Monitor Settings
Use Monitor Settings to view the settings for all the monitors associated with your account.
The Monitor Settings tab is divided into the following sections:
Page
The Page tab lists the pages that are available to be monitored. To view the basic settings for that monitor, click a monitor header to expand and view the details.
- Select from the appropriate buttons on the header of every monitor to customize it:
- Add a Page Monitor: Click to open a new monitor settings page. The ratio shows the number of contracted test slots, page, or steps and how many of those are currently being utilized in the account.
- Edit button: Click to edit the settings for the selected monitor (only available if your portal user account has Account Administrator privileges)
- Manual test: Run a manual test for that monitor.
- Delete: Click to a delete the selected monitor from the account.
- Save Settings: Click to apply any changes made to any of the monitor settings in this section.
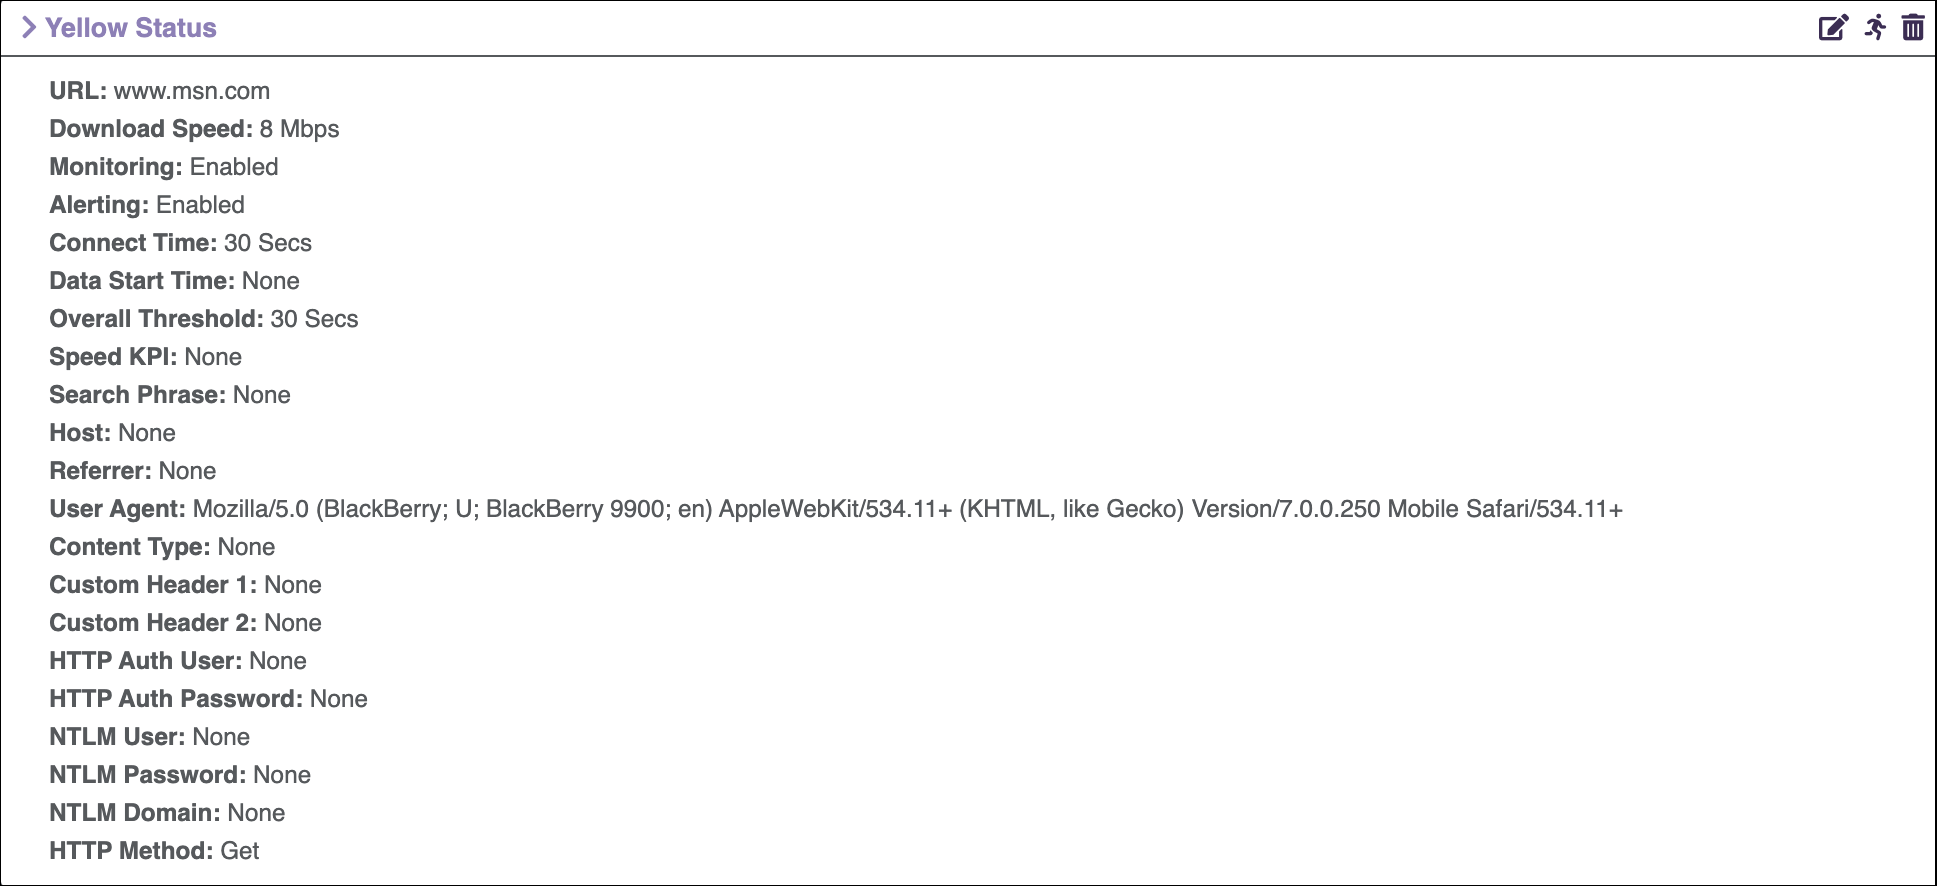
- Clicking Add a Page Monitor prompts you to enter the following settings:

- URL: This is the URL to be tested, which can be a hostname, IP, or GET with parameters and the label for the monitor that will display in the reports and on any XML data feed.
- Label: The label for the monitor that will display in the report.
- Notes: Add notes to the monitor page or step, as required.
- Download Speed: This is the fixed bandwidth for the connection the agent will use to test the page or step.
- Monitoring: Enable or disable monitoring (not applicable to Step level settings within a user journey).
- Alerting: Enable or disable alerting.
- Thresholds: Define the success criteria for the page monitor or step.
- Connect Time: If the agent takes longer than the configured threshold to make an HTTP/HTTPS connection to the webserver then an error will be recorded.
- Data Start Time: An error will be recorded if the site takes longer than the time configured to return the 1st byte of data in the response for the 1st object in the page/step.
- Overall Threshold: Time allowed for the whole test to complete.
- IM Threshold: Time allowed for the whole test to complete on the International Monitoring.
- Speed KPI: Not used to trigger errors. Results appear in the Status report within the Summary Reporting section.
- Search Phrase: Enter any text strings that are useful to identify the correct response to the page/step request. New lines are for individual strings. The parser will scan the source files of the page to find the strings entered.
- Search Logic: The presence or absence of the strings can be selected and whether the complete list or just one of the strings should indicate success or failure.
- Page Size: Two fields define the minimum and maximum page size thresholds.
- Objects: Select the number of missing objects (404 responses only) to trigger a critical error instead of the normal warning error that wouldn’t generate an alert message.
- Extra Files: Enter the URL of any file you would like to include/exclude by completing the URL field. You can specify any text that must be present within the monitor's source code using the Required Text field and choose whether the file should be included or excluded using the Mode field. You can use Exclude (Partial Match) mode to exclude any file whose URL contains the text entered in the URL field. For example, 'image' would match 'image.gif', 'image1.gif' and 'http://site.com/image/logo.gif'. When using the Include and Exclude (Exact Match) modes the URL field must contain a fully qualified URL to the file, for example: http://your.site.tld/path/filename.ext.
- Add Extra File button: Click this to add extra row(s), which enables adding additional objects to include or exclude.
- Custom Header: This section enables custom headers to be used to correctly replicate what is sent from a real browser or force the test agent to use a particular HTTP header.
- User Agent: This field is particularly useful for ensuring the agent gets the version of the website that should be tested. You can also use this to make the webserver provide the mobile version of the page.
- HTTP Auth / NTLM User and Password: Useful to enable monitoring of protected servers.
General settings
HTTP Headers
User Journey
The User Journey tab lets you view and edit the settings for the overall journey, including KPIs for the whole user journey completion time.
To start viewing the settings, select the user journey and click View Settings. You can expand the steps to show the basic settings for that step.
The options to edit and run a manual test for a user journey become available after you select a user journey.
- Edit button: Click this button to edit the settings for the selected monitor (only available if your portal user account has Account Administrator privileges).
- Manual test: Click this button to run a manual test for that monitor.
If your user journey steps include POST parameters, then they will be displayed in the basic settings page. If the Value shows as DYNAMIC, then the script maintains that value automatically and dynamically and maybe depending on the response from the step before.
Editing a POST parameter may break the user journey if subsequent steps depend on a particular flow or outcome that depends on it.
Web Service
The Web Service tab lets you view and edit the settings for a web service. To start viewing the settings of a particular web service, select it from the drop-down list and click View Settings. Click Save Settings at the bottom of the page to apply your changes.
![]() Eggplantsoftware.com | Documentation Home | User Forums | Support | Copyright © 2022 Eggplant
Eggplantsoftware.com | Documentation Home | User Forums | Support | Copyright © 2022 Eggplant