Exploratory Dashboard
The Exploratory dashboard provides a high-level overview of your testing, presented in report form. Most reports appear blank until you have executed a model at least once. The exceptions are the Bug Hunting and Test Cases reports, which have additional requirements.
Launching the Exploratory Dashboard
To get started, simply go to Dashboards > Exploratory.
The Exploratory Dashboard
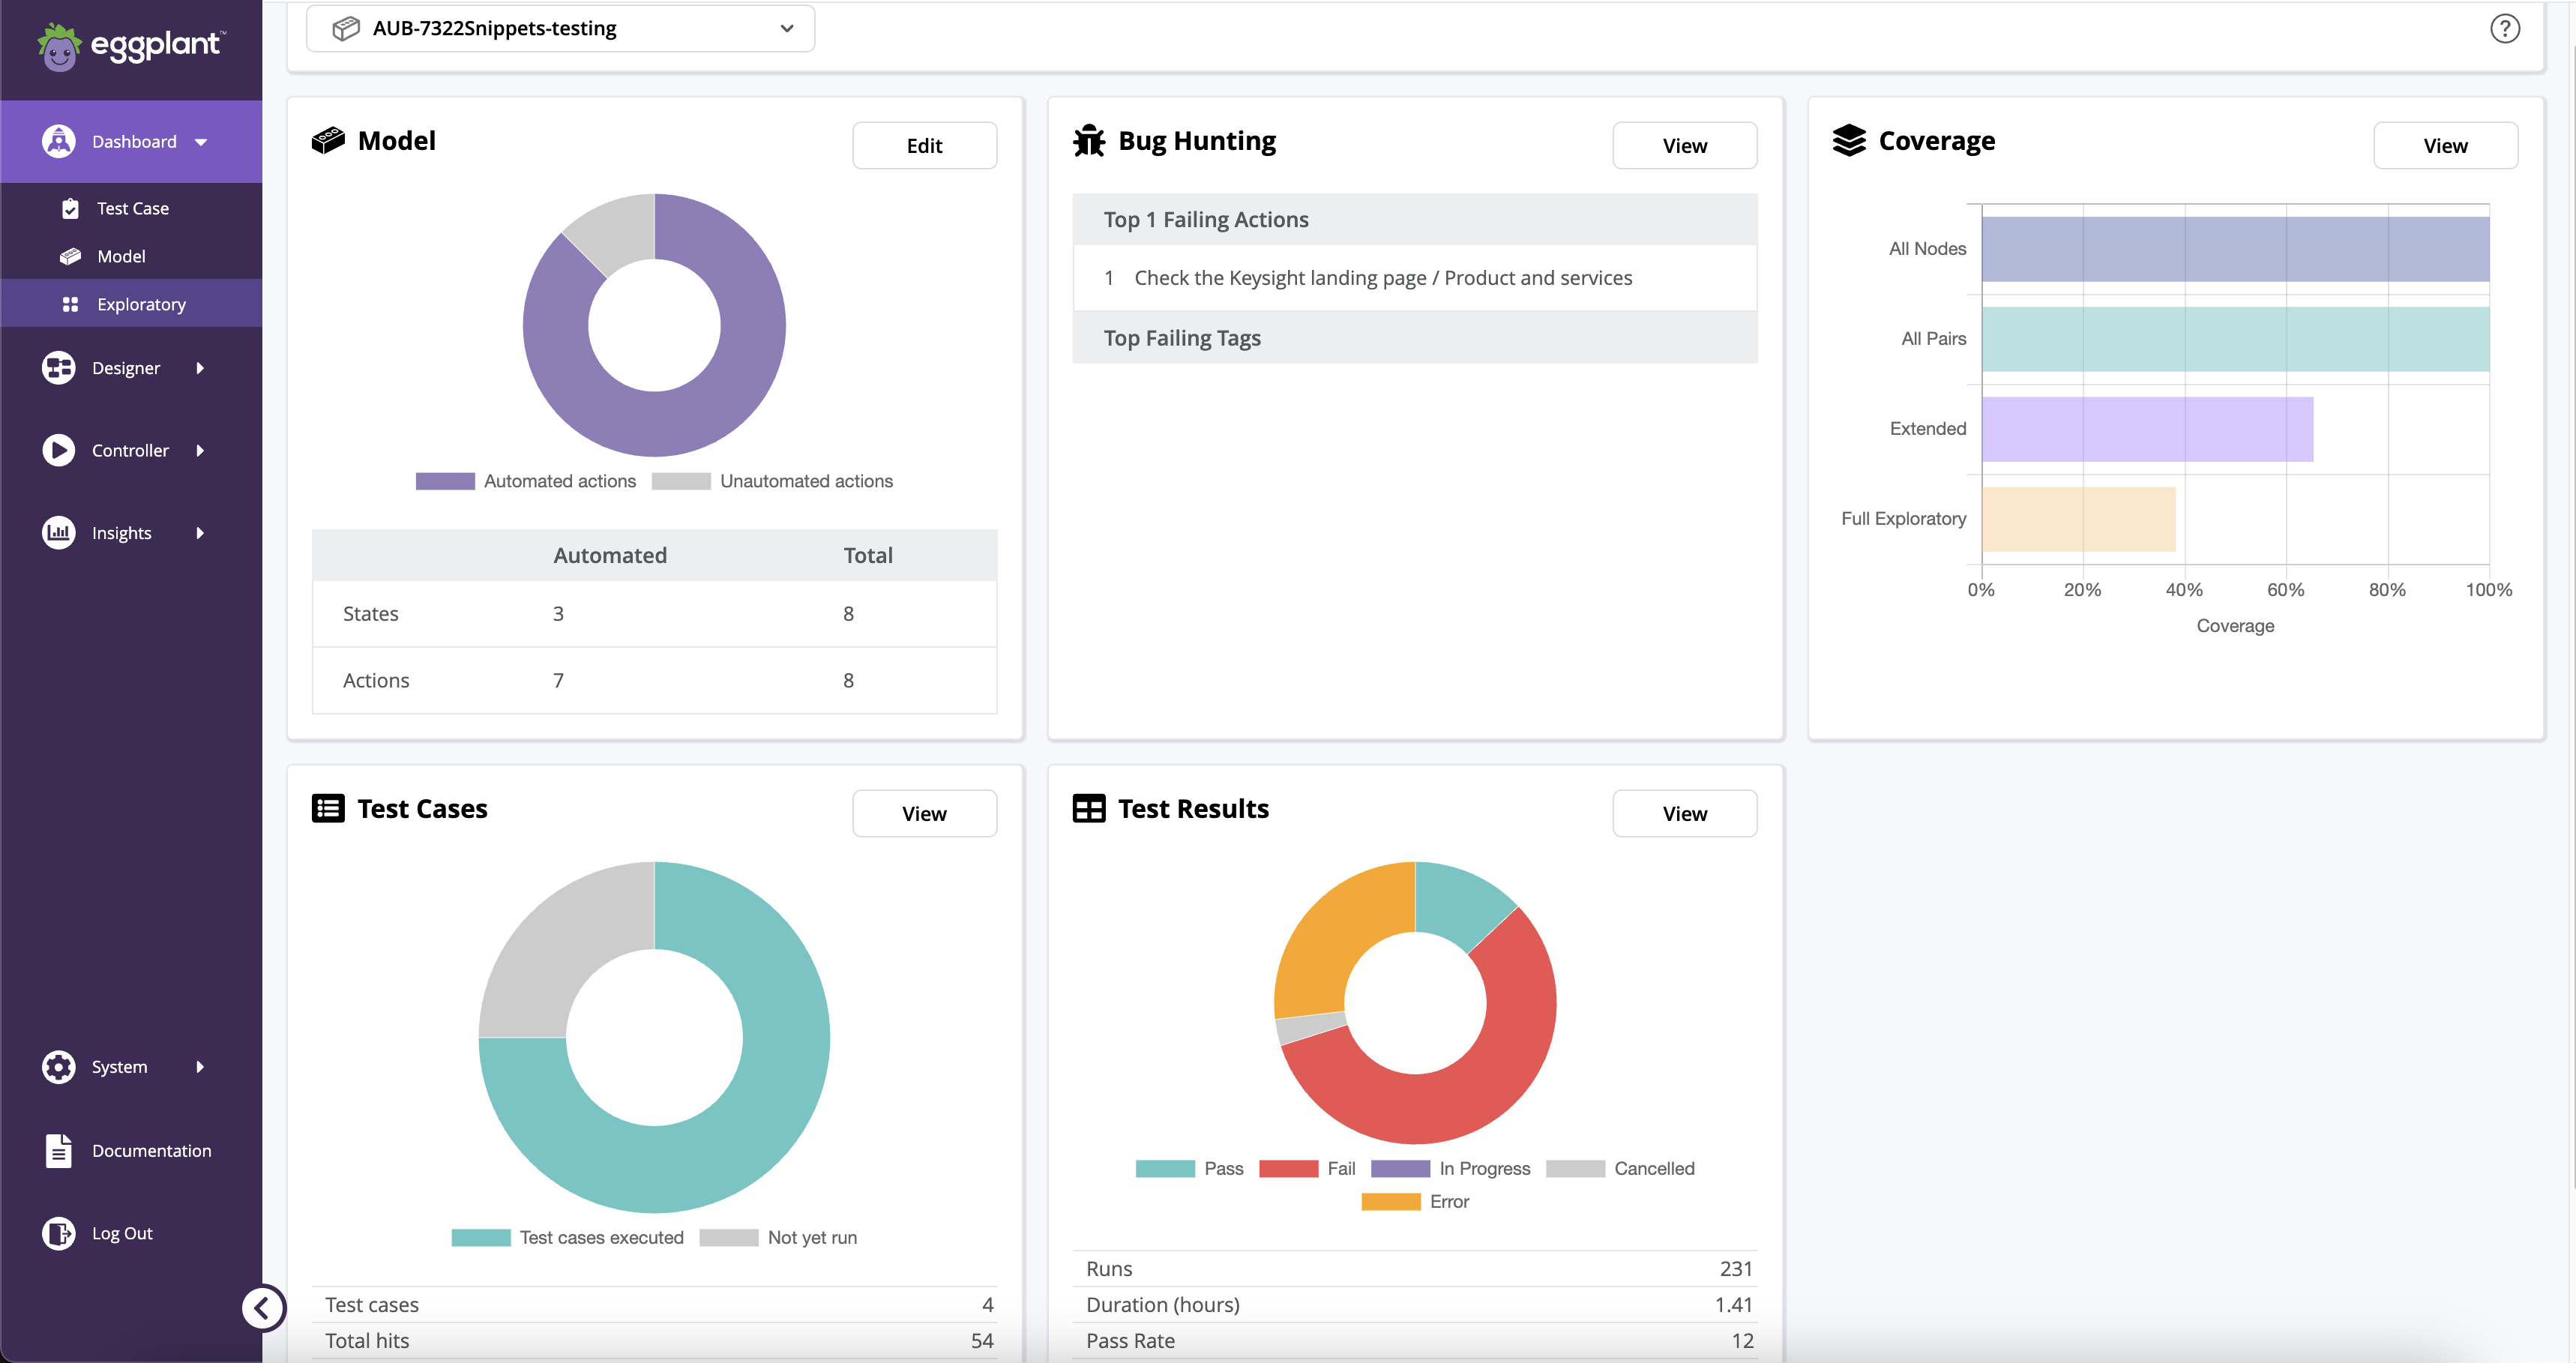
The following reports make up the Exploratory Dashboard.
The Exploratory Dashboard
Note: All reports appear blank until you run at least one test case either as a model execution or as a Directed Test Case
Model Selector
The drop-down list of available models you can select to view in this dashboard. The selector also provides a search capability, so the list shortens when you start typing to help you quickly find the model you want.
Model
A donut chart showing automated and unautomated actions. Hover over the donut colors to see details. Below the chart, you see a comparison of automated states and actions run with the total number of states and actions. This widget has an Edit button you can click to open the model in the Designer.
Bug Hunting
A donut chart showing the top failing actions and tags. Hover over the donut colors to see details. If you see the "No failures detected, all good!" message, it means no failures were detected for the model runs. This widget has a View button you can click to go to the Bug Hunting History for the model. To learn more, see Bug Hunting.
Coverage
A bar chart showing the percentage of the test coverage completed for the following categories: All Nodes, All Pairs, Extended, and Full Exploratory. Hover over the bars to see details. This widget has a View button to take you to the coverage page.
Test Cases
Donut chart showing the test cases run and not run. Hover over the donut colors to see details. Below the chart, you can see the number of test cases run, and the total number of hits for a case. This widget has a View button you can click to see the list of test cases.
Test Results
A donut chart showing you the Pass, Fail, In Progress, Cancelled, and Error result status for the model runs. Hover over the donut colors to see details. Below the chart, you can see a summary of the number of Runs, the Duration of the runs in hours, and the Pass Rate. This widget has a View button you can click to see the list of test results.