テストケースダッシュボード
テストケースダッシュボードは、スクリプトベースおよびモデルベースのテストケースに関する様々なレポートの概��要を提供します。このダッシュボードを使用して、すべてのテストケースに関する集約データを分析し、情報に基づいた意思決定を行い、テストプロセスを向上させることができます。デフォルトでは、ダッシュボードは過去7日間のデータを表示し、すべてのモデルとSuiteをカバーします。ただし、特定のモデルやSuiteに焦点を当てるために、日付範囲をカスタマイズし、フィルターを適用してビューを調整することができます。
- DAIバージョン6.1以前に作成されたテストケースに関する情報は、テストケースIDがないため、このダッシュボードには表示されません。
- テストケースダッシュボードのテストケース結果の合計数は、テスト結果の数と異なる場合があります。
テストケースダッシュボードの起動
開始するには、Dashboards > Test Casesに移動します。
テストケースダッシュボード
以下のレポートでテストケースダッシュボードが構成されています。各レポートには、報告されているデータの説明を提供するヘルプ(?)ボタンがあります。
- フィルタ
- テストケース実行概要バー
- 日別テストケース実行数
- ステータス別テストケース結果
- 最も実行時間の長いトップ10テストケース
- 失敗したトップ10テストケース
- エラーが発生したトップ10テストケース

注: モデル実行または指示されたテストケースとして少なくとも1つのテストケースを実行するまで、すべてのレポートは空白のまま表示されます。
フィルタ
ダッシュボードフィルタを使用すると、ダッシュボー�ド上のすべてのテストケースレポートを特定のニーズに合わせてカスタマイズできます。日付範囲を調整し、特定のモデルやSuiteにフィルターを適用することで、ダッシュボードをパーソナライズできます。

- Date range: 特定の期間にわたってテストケースダッシュボードを表示するために、カスタム日付範囲を設定できます。デフォルトでは、ダッシュボードは過去7日間の結果を表示します。
- Model or Suite: 特定のモデルまたはSuiteでフィルタリングし、希望する範囲に絞り込みます。
テストケース実行概要バー
テストケース実行概要バーは、ダッシュボードレベルで適用されたフィルタに基づいて、様々なテストケース統計への高レベルの概要と迅速なアクセスを提供します。

一部のレポートには、テストケース結果のリストを表示するための矢印付きのボタンが含まれています:
-
Test cases completed: 完了したテストケースの合計数を表示します。
-
Total execution time: すべてのテストケース実行にかかった累積実行時間を表示します。
-
Passed: 成功裏に合格したテストケースの数を表示します。
-
Failed: 失敗したテストケースの数を表示します。
-
Error: 実行中にエラーが発生したテストケースを表示します。
-
Cancelled: キャンセルされたテストケース実行を表示します。
-
In progress: 現在実行中のテストケースを表示し、進行中のテスト活動を追跡できます。
日別テストケース実行数
日別テストケース実行数レポートは、ダッシュボードレベルで適用されたフィルタに基づいて、時間の経過とともに異なるテストケースの結果の分布に関する洞察を提供します。

-
Graph: 合格、失敗、エラー、キャンセルのテストケース結果を日別に視覚的に表現します。線上のデータポイントにホバーすると、日付と実行結果が表示されます。
-
View all: このボタンをクリックすると、テスト結果ページで全てのテストケースとその結果のリストが表示されます。
ステータス別テストケース結果
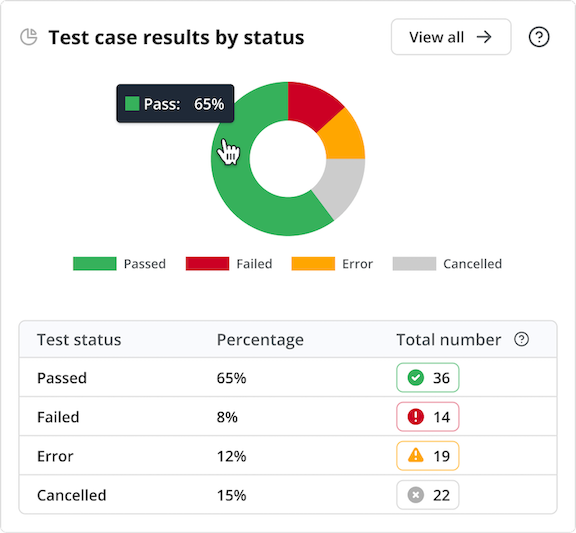
ステータス別テストケース結果レポートは、ダッシュボードレベルで適用されたフィルタに基づいて、テストケースのステータス分布に関する洞察を提供します。このレポートを使用して、テストケースの全体的なパフォーマンスを追跡し、理解することができます。

-
Runステータス内訳ドーナツチャート: 異なる実行ステータス(合格、失敗、エラー、キャンセル)にわたるテストケースの分布を表示し、それぞれの相対的な割合を示します。各ステータスをクリックすると、ステータス別のテストケース結果のリストにアクセスできます。
-
Run status table: 各実行ステータス(合格、失敗、エラー、キャンセル) におけるテストケースの合計数と割合を表示します。各ステータスをクリックすると、ステータス別のテストケースのリストにアクセスできます。
-
View all: このボタンをクリックすると、テスト結果ページで全てのテストケースとその結果のリストが表示されます。
最も実行時間の長いトップ10テストケース
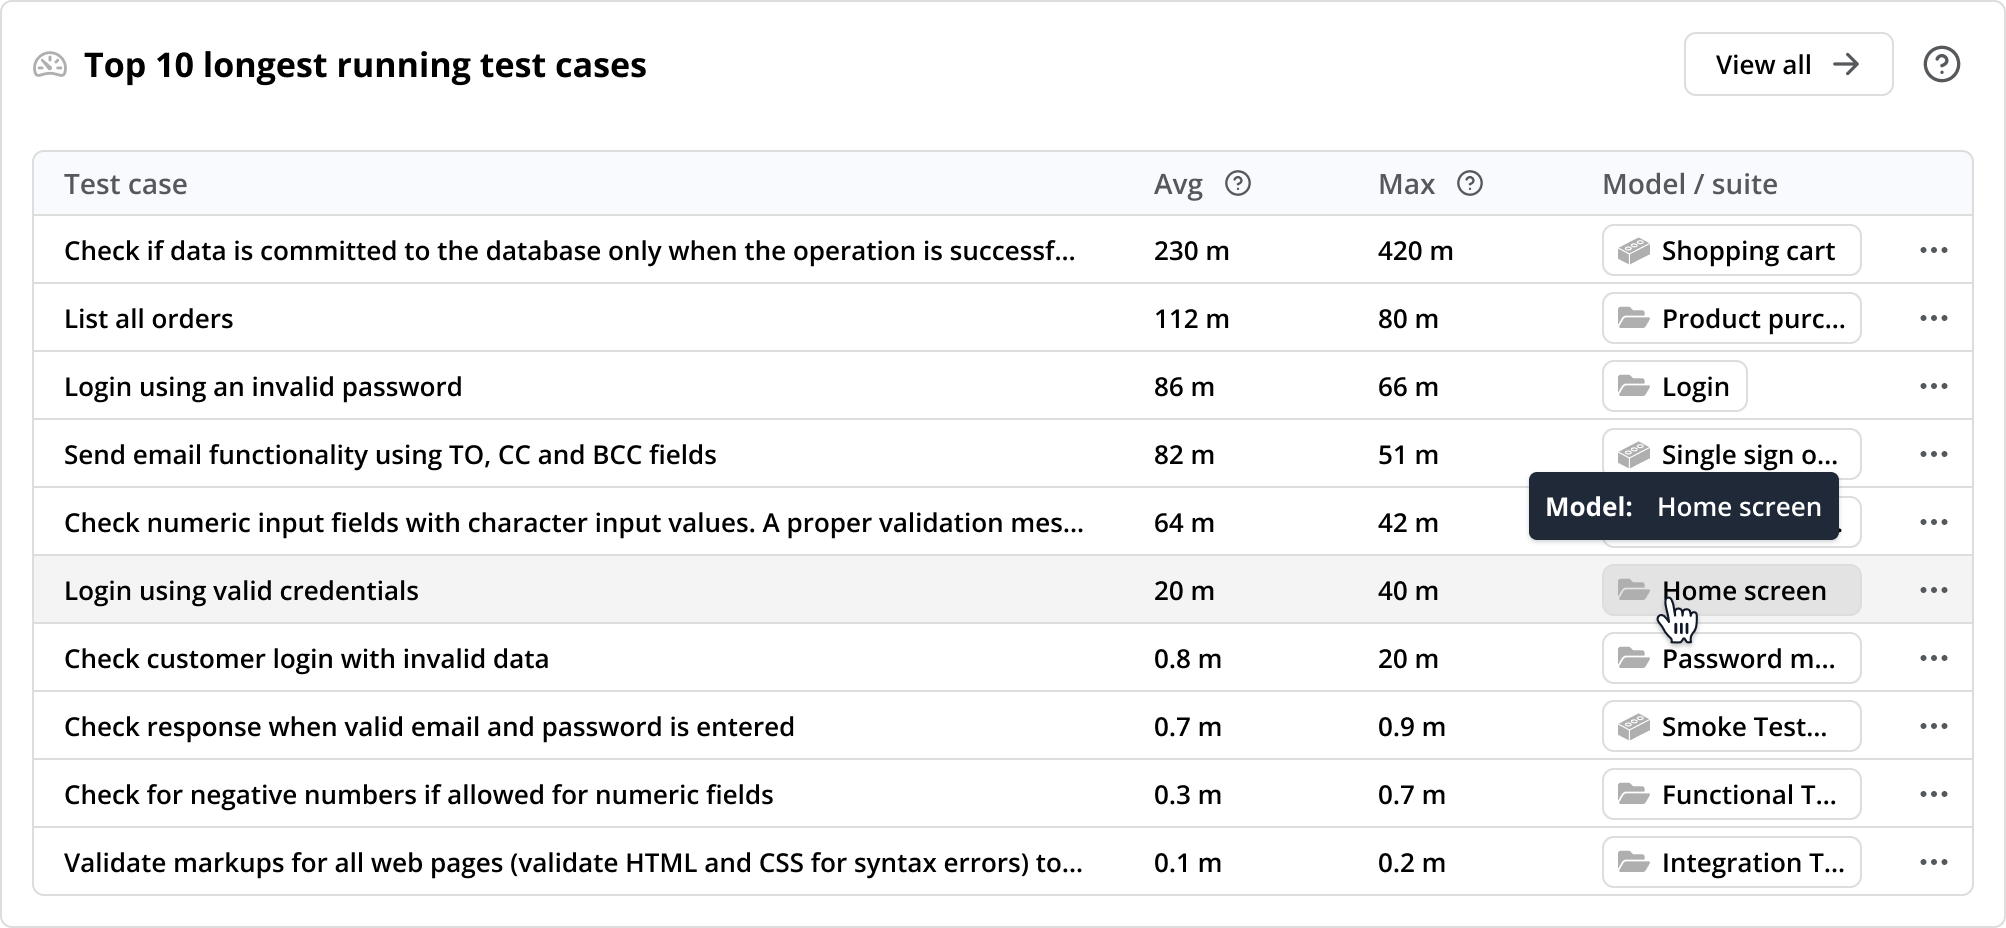
最も実行時間の長いトップ10テストケースレポートは、ダッシュボードレベルで適用されたフィルタに基づいて、最も長いテストケース実行のトップ10を特定します。このレポートは、テストの実行時間に関する洞察を提供し、各テストケースの最大および平均実行時間を示します。また、それらが属するモデルやSuiteも表示し、パフォーマンスの問題を特定して対処することができます。

-
Test case: 最も実行時間の長い10のテストケースの名前を表示します。
-
Execution time: 各テストケース実行の最大および平均実行時間を表示し、テストケースのパフォーマンスを理解するのに役立ちます。
-
Average time to execute (Avg): すべてのテスト実行にかかった平均時間。
-
Maximum time to execute (Max): テスト実行にかかった最大時間。
-
-
Model/Suite: テストケースが使用するモデルまたはSuiteを表示します。
-
Test case results: テストケースをクリックすると、テスト結果ページでその実行時間に関する包括的な理解を得ることができます。
-
Test case actions menu: 三点メニューをクリックすると、新しいタブで特定のテストケースを開き、それを表示または編集できます。
-
View all: このボタンをクリックすると、テスト結果ページで実行平均時間に基づいてソートさ�れた10のテストケースとその結果のリストが表示されます。
失敗したトップ10テストケース
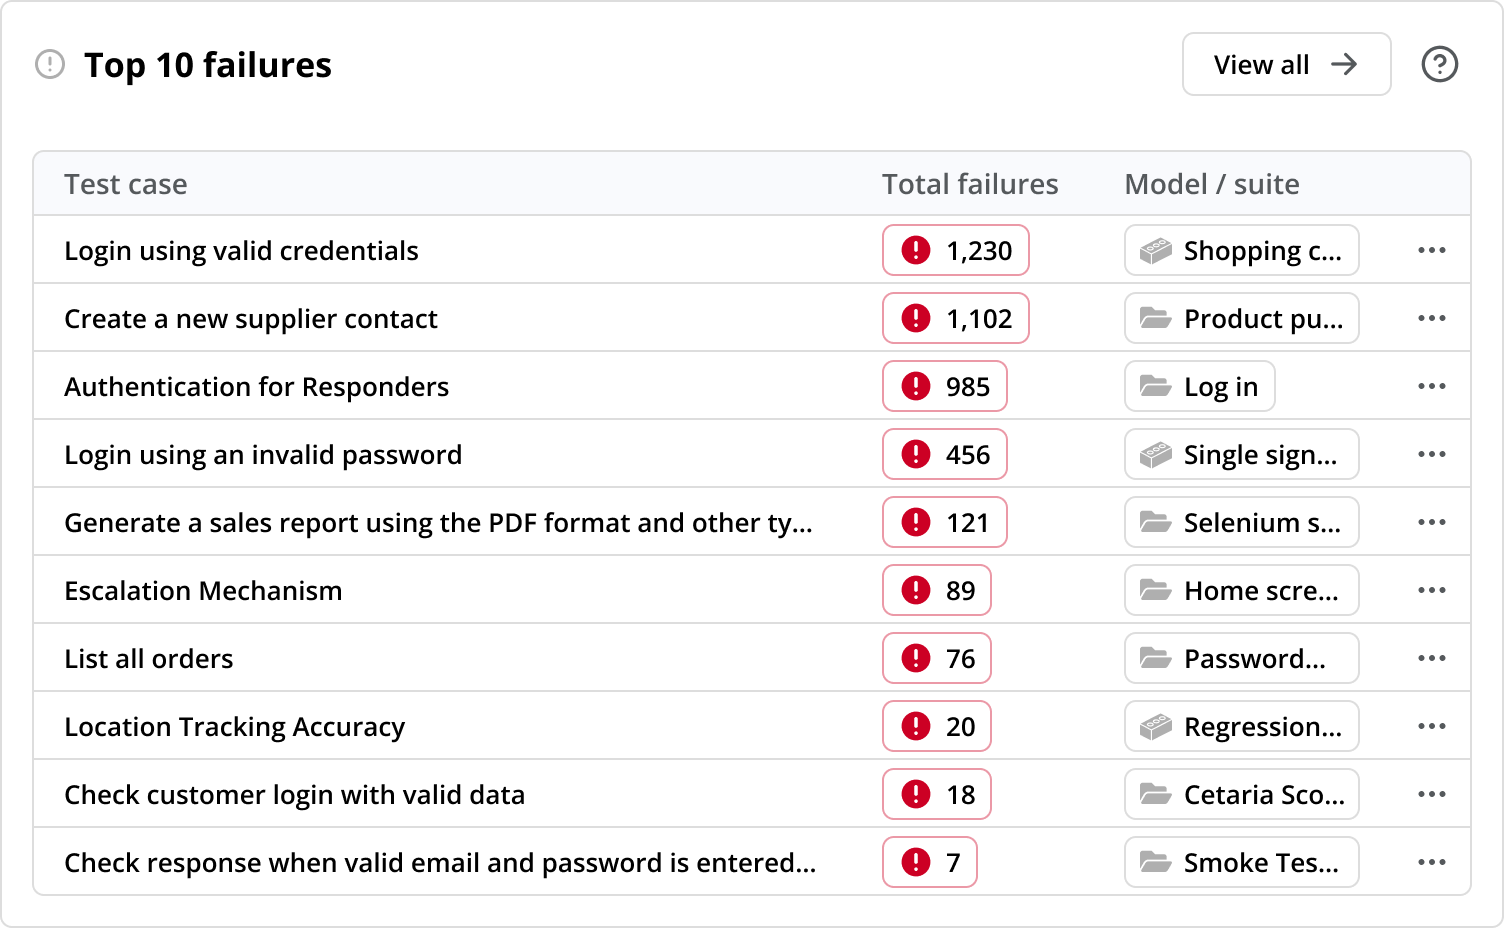
失敗したトップ10テストケースレポートは、ダッシュボードレベルで適用されたフィルタに基づいて、最も多くの失敗を経験したテストケースを示します。このレポートは、直ちに注意を要する領域に焦点を当てるのに役立ちます。

-
Test case: 最も失敗が多かった10のテストケースの名前を表示します。
-
Total Failures: 最も失敗数の多い10のテストケースにおける失敗数を降順で表示します。これにより、繰り返し発生する問題を特定することができます。
-
Fail overview: テストケースをクリックし、すべての失敗を探ることで、遭遇した問題についてより深く理解することができます。
-
Model/Suite テストケースが使用するモデルまたはSuiteを表示します。
-
Test case actions: 三点Actionメニューをクリックすると、新しいタブで特定のテストケースを開き、それを表示または編集できます。
-
View all: このボタンをクリックすると、テスト結果ページで失敗したすべてのテストケースのリストが表示されます。
エラーが発生したトップ10テストケース
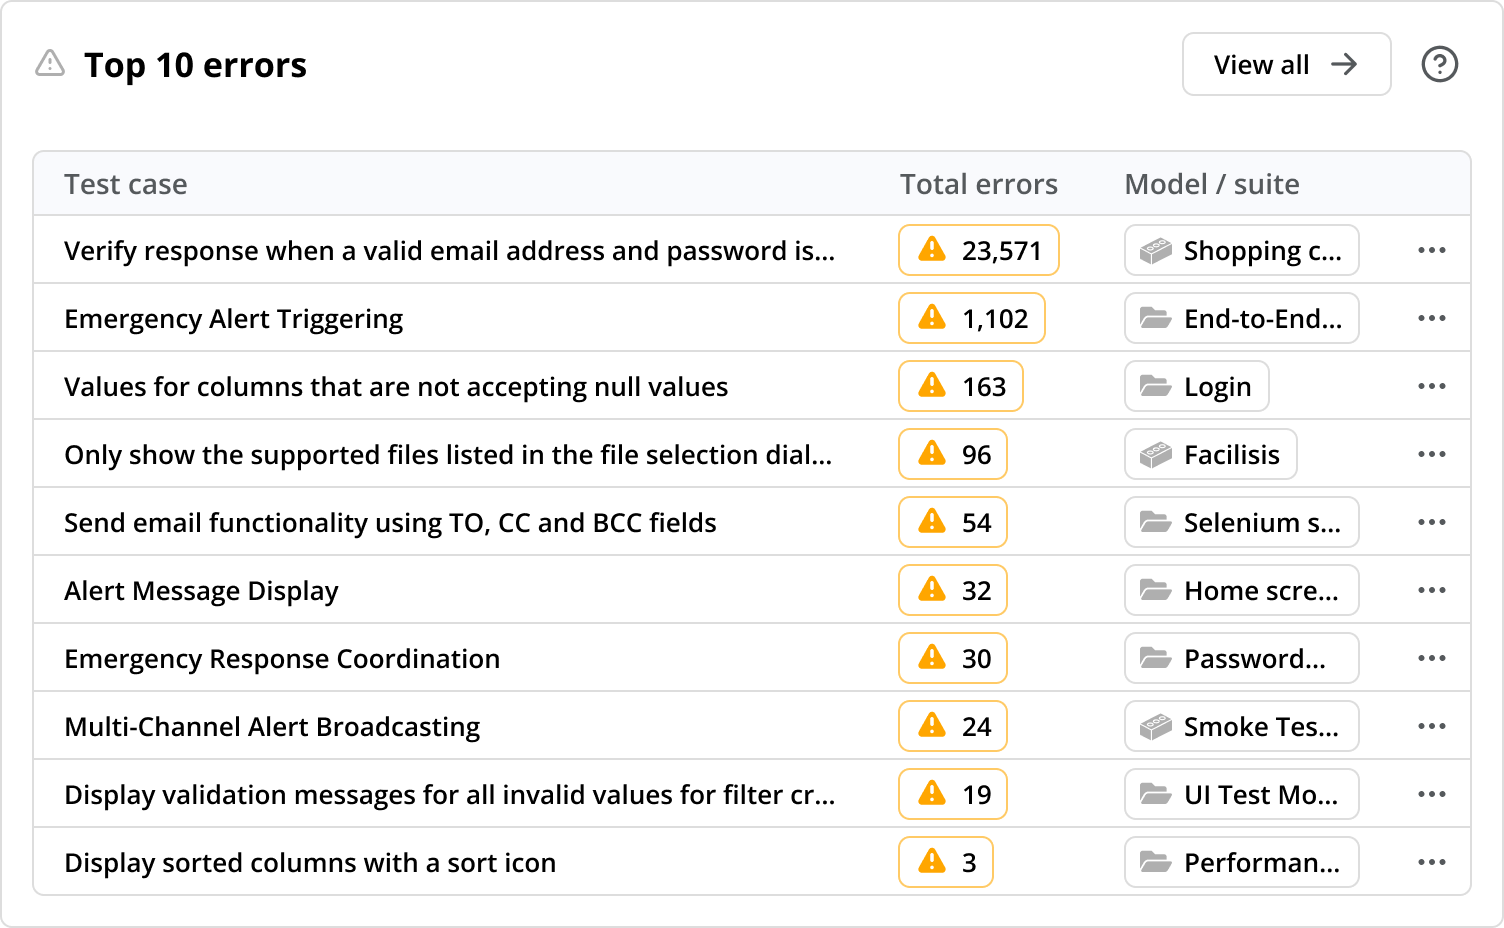
エラーが発生したトップ10テストケースレポートは、ダッシュボードレベルで適用されたフィルタに基づいて、最も多くのエラーを経験したテストケースを示します。このレポートは、繰り返し発生するエラーを特定し、注意を要する領域に焦点を当てるのに役立ちます。

-
Test case: 最もエラーが多かった10のテストケースの名前を表示します。
-
Total Errors: 最もエラー数の多い10のテストケースにおけるエラー数を表示します。
-
Error overview: 個々のテストケースをクリックし、そのエラーを探ることで、遭遇した問題についてより深く理解することができます。
-
Model/Suite テストケースが使用するモデルまたはSuiteを表示します。
-
Test case actions: 三点メニューをクリックすると、新しいタブで特定のテストケースを開き、それを表示または編集できます。
-
View all: このボタンをクリックすると、テスト結果ページでエラーが発生したすべてのテストケースのリストが表示されます。