It is important that your Eggplant Functional scripts be syntactically and semantically correct. It is equally essential that your scripts drive exactly the actions that you require in your system under test (SUT) and automate the user story from end to end.
Eggplant Functional includes several features to help you debug your scripts. Here we discuss those features as well as some related debugging strategies. This article focuses on debugging your script code; information specific to image debugging can be found in Image Update Panel and Image Capture Best Practices.
Debug Mode
One good approach to debugging a script is to analyze the effect that each script statement produces on your SUT. You can achieve this effect by running a script in debug mode. While in debug mode, your script executes a single statement, then pauses until you choose to execute the next statement. This method lets you confirm that each specific piece of code produces the desired or expected effect on your SUT.
To run a script in debug mode, go to Run > Debug Script (or Run > Debug Selection) on the main menu:
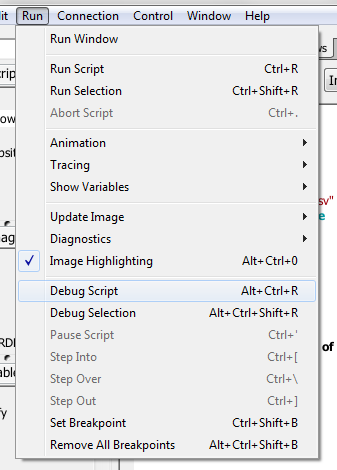
Note: Debug Selection is available only if a section of the code is selected in the Script Editor.
You can also run a script in debug mode by holding down the Alt key (Windows) or Command key (Mac OS X) and then clicking either Run Script or Run Selection on the Script Editor toolbar. You can find more information about Run window options in The Run Window.
When running in debug mode, we recommend that you use the Animate All setting (Run > Animation > Animate All). This setting highlights the current line (or next line of code to execute if the script is paused) in the Script Display area of the Run window. Furthermore, you can use Tracing (Run > Tracing > Trace All), which causes Eggplant Functionall to "echo" information about what the script is about to execute to the Log area in the Run window. You can read more about these features in The Run Window.
When you start a script in debug mode with animation enabled, the first line of your script is highlighted in the Run window, and it will not have executed:
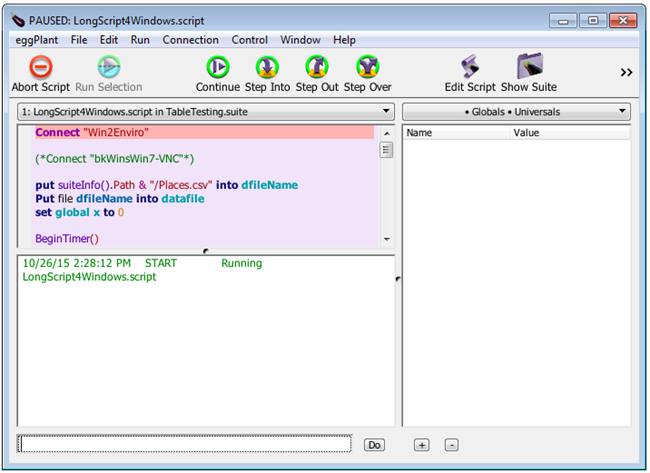
The Script Display in the Run windows highlights the current line if you use animation.
To "step" through your script, statement by statement, click the Step Into button each time you want to execute the highlighted line. The highlighted line is executed, and the next line is highlighted while the script pauses again.
With each step, you can watch the effect on the SUT in the Viewer window (or possibly in the actual SUT, depending on your test environment). If executing a line of your script produces an undesired or unexpected effect, you’ve found a bug! You can navigate back to the Suite window to edit your script by clicking the Edit Script button. If you’re not ready to edit your script, consider adding comment text about what happened to the section of the script where you've observed the error.
If executing a line of your code fails (say, because you didn’t provide a time parameter for a WaitFor command), the script execution stops and the Run window displays the reason for the failure. This behavior is exactly the same as when running a script normally (i.e., not in debug mode).
After the last line of your script has run, click Step Into once more to complete execution of the script.
For information about using other buttons on the Run window while executing a script in debug mode, such as Pause/Continue, Step Over, and Step Out, see The Run Window Toolbar.
Dynamic Breakpoints
In Eggplant Functional, you can set dynamic breakpoints in your script. When set, a breakpoint pauses the script run at that specific point until you choose to move forward.
Using dynamic breakpoints is particularly helpful if some parts of your script are working well but there remain some trouble spots that you need to investigate more closely. In such cases, it could prove tedious to run in debug mode through sections that you know are functioning properly. Therefore, you could set dynamic breakpoints at the sections of code that you've identified as still needing work, so the script run stops only at those points.
Setting dynamic breakpoints is also helpful if you’re working with large scripts and you need your SUT to be in a mid-script state for monitoring. You would set a breakpoint in the script, then run the script till it stops at that point, which would then let you examine the SUT to see if it matches the expected state.
To set a dynamic breakpoint, click in the column to the left of the Script Display area in the Run window. You can also set a breakpoint in the Script Editor by clicking in the column to the left of the script. A black triangle appears next to the line, denoting the breakpoint. When the script runs, it pauses before running lines with set breakpoints.
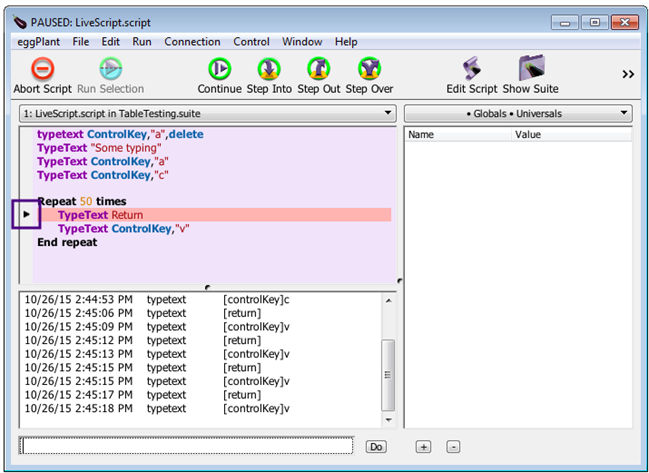
Dynamic breakpoints appear as black triangles to the left of the script line on which they are set.
You can include multiple breakpoints in a script. You can move a breakpoint by dragging the triangle to another line in the script, or remove it by dragging it out of the column. Because dynamic breakpoints pause the script, you can use the debugging buttons (Step Into, Step Over, Step Out) just as you would if you had started the script run in debug mode.
The Ad Hoc Do Box and the Variable Watcher
The Ad Hoc Do Box (AHDB) and the Variable Watcher are tools on the Run window that let you check the status of running scripts and the SUT environment, as well as take actions. The AHDB is the text field at the bottom of the Run window, and the Variable Watcher is a panel on the right side of the window:
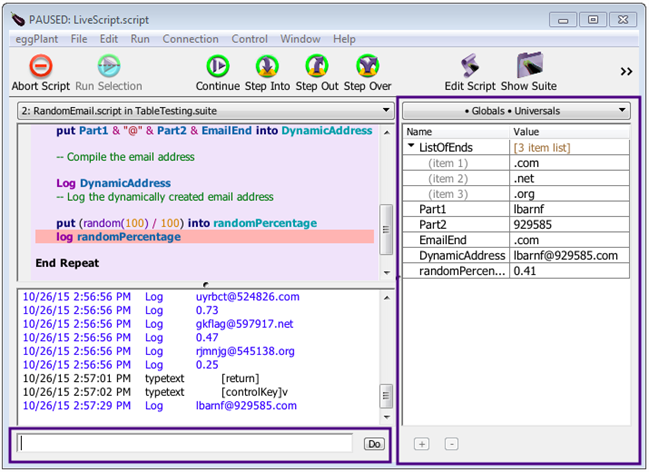
The Eggplant Functional Run window includes the Ad Hoc Do Box (AHDB) and Variable Watcher for script debugging.
The AHDB lets you interact with and modify a script during execution. For example, you can assign values to variables, execute commands, or call other scripts. This ability lets you change your script environment or SUT environment as needed. For example, if a section of code didn't run as expected, you could pause the script, reset the conditions of the SUT, then re-run the lines of code through the AHDB before continuing with the run of the script.
You can use the AHDB either while the script is running or paused. If you enter a command while the script is running, it is executed after the current line finishes, and then the script returns to its normal execution. However, because scripts often run through lines quickly, using the AHDB while the script is running can be fairly imprecise.
For more precision, you can use the AHDB while your script is paused. Remember, you can pause a running script by running in debug mode, by setting a dynamic breakpoint, or by clicking Pause on the Run window while the script is running.
To use the AHDB, enter a command into the AHDB, such as Put variableTest, then click the Do button. In this case, the Put command outputs the contents of variableTest into the Log area of the Run window.
Commands entered in the AHDB show in the Log area of the Run window.
You can also check that variables contain expected types of values, such as a list, a number, a string of text, and so forth. For instance, entering Put variableTest is a list and clicking Do outputs a boolean value of True or False to the Run window; the actual value you see is determined by the current value of the variable. (See the Logical Operators page for additional comparisons you can make.)
For tracking variable values in your script, you might prefer to use the Variable Watcher. If you enable this pane, you can view every variable in you script and its current value. Further, you can change variable values directly in this pane as well. The Variable Watcher lets you filter the view to the types of variable you want to see between local, global, and universal variables. For complete information on using the Variable Watcher, see The Variable Watcher.
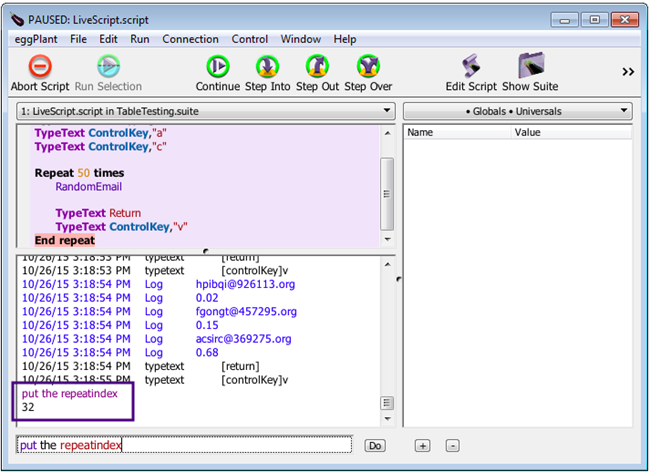
The AHDB is also helpful for debugging repeat loops in your script. When script execution enters a repeat loop, you can use the AHDB to determine the current iteration of the loop. To do this, enter Put counter() or Put the repeatIndex into the AHDB and click Do. Either of these options outputs the current iteration of the loop that is being executed. (Note: If there are nested repeat loops being executed, then counter() and repeatIndex() report the iteration of the innermost repeat loop under execution.) See Repeat Loops for more information about repeat loops and the counter() and repeatIndex() functions.
The AHDB and the Variable Watcher make debugging scripts easier. Rather than cluttering your test scripts with commands to confirm the contents or type of a variable, or to verify whether the correct image is found at a certain step, you can get this information directly from the Run window.
Finding and Solving Problems
The features listed above are far from an exhaustive list of debugging options. These Eggplant Functional methods can point you in the right direction to finding problems with your scripts. Although these debugging controls won't solve your problems for you, they can at least pinpoint trouble spots and help you know where your scripts aren't performing to your expectations.
![]() Eggplantsoftware.com | Documentation Home | User Forums | Support | Copyright © 2022 Eggplant
Eggplantsoftware.com | Documentation Home | User Forums | Support | Copyright © 2022 Eggplant