Working with imported Test Run Data in Eggplant Performance Analyzer
The wizard offers various configuration options to help you customize the analysis view. In fact, you can create multiple different analysis views from the same original test run results.
Selecting a Test Run for Analysis
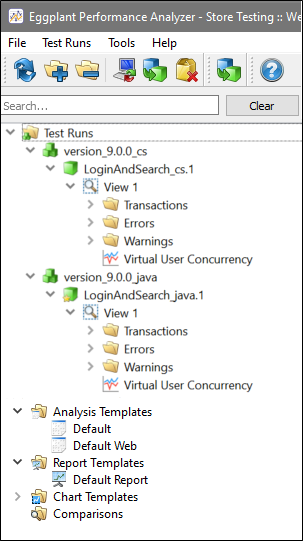
Eggplant Performance Analyzer displays your test run results in the Project tree. The first top-level node within the Project tree is a folder for Test Runs. Within the Test Runs folder, you'll find a node for each test run series, and below each test run series, the individual test runs are listed. Each test run name takes the form <test_name>.<run_number>.

The Eggplant Performance Analyzer Project tree
To help you determine which test runs to analyze, you can view the summary details of each test run. If you select the test run series in the Project tree, the Viewer pane lists brief details for all test runs in the series, including whether the test completed, the start and end times, and the duration of the test.
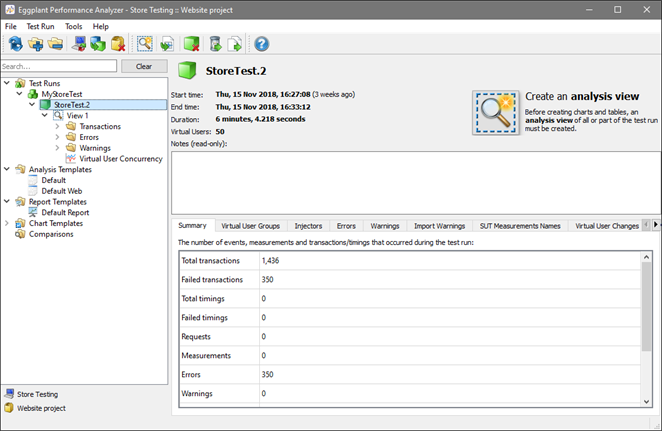
If you select a specific test run in the Project tree, the Viewer pane provides more detailed information about that test run. The summary information for the test appears at the top of the Viewer pane. At the bottom, you'll find tabs where you can view test run results data, including number of transactions, number of errors and warnings, and so forth. On the additional tabs, you can find information about the original settings for this test, including virtual user (VU) group information and the injectors used.

Viewing summary information for a test run in Analyzer
When you have selected a test run, you're ready to create an analysis view of your data. See Creating an Analysis View in Eggplant Performance Analyzer for information about creating analysis views.