Create a Monitoring Target
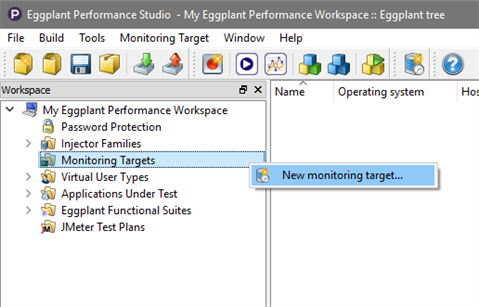
Creating a monitoring target is the first (optional) step of the Add Monitors Wizard.

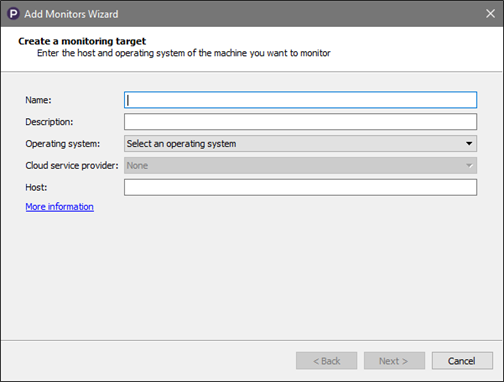
The wizard opens with the Create a monitoring target page:

Name: You must enter a name to identify the monitoring target within Studio; the monitoring target appears in the workspace tree with this name.
Description: Enter a brief description (optional).
Operating system: Select the operating system of the machine you want to monitor from the drop-down list.
Cloud service provider: If you select Linux or Windows for the operating system, this field gets enabled. You can select a cloud provider to use as the monitoring target; as with cloud injectors, you can select Amazon EC2, Microsoft Azure, or Eggplant Cloud. The default is None if you don't plan to use a cloud service.
New feature: The Eggplant Cloud option is available in Eggplant Performance 9.1 and later.
Host: Enter the hostname or the IP address of the computer that this monitoring target represents; for cloud service providers, enter the Instance ID (AMI ID for EC2) or the Virtual Machine Name (for Azure).
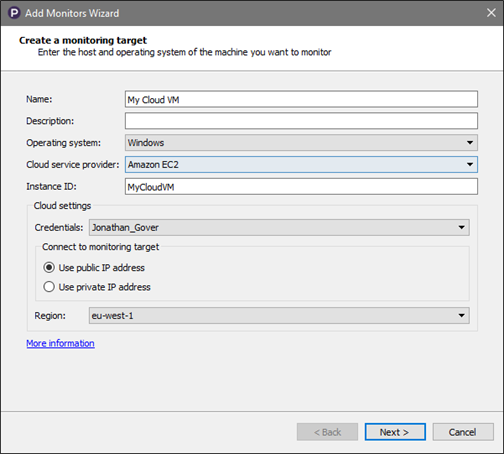
When you select a cloud service provider as the monitoring target, additional fields appear on this page of the wizard under Cloud settings:

- Credentials: Select the appropriate stored credentials from the drop-down list; only credentials for the chosen service provider are displayed.
- Connect to monitoring target: You can choose either Use public IP address or Use private IP address.
For Amazon EC2 and Eggplant Cloud only:
- Region: Choose the appropriate region from the drop-down list.
For Microsoft Azure only:
- Service name: Enter the service name of the instance you want to monitor.
- Deployment name: Enter the deployment name of the instance you want to monitor.
During a test, active monitors need to connect to this monitoring target from the injector machine on which they are running. The hostname or IP address specified here must be reachable from the injector machine; a connection test is performed later in the wizard. If the injector machine is the same as the system under test (SUT), you can enter localhost in the Host box.
The Operating system must be selected so that on the following wizard page, only those measurement templates which apply to this operating system will be displayed.
Next step in the wizard: Select measurement templates