This is last part of our Eggplant Performance quick start guide. Here we focus on the functionality of the Eggplant Performance Analyzer application to transform the raw data from your test into charts, providing a graphical representation of the results Eggplant Performance Analyzer provides reports that contain both charts and test result summary information.
Tasks related to analyzing and viewing test results are discussed below.
Flagging a Test Run for Later Analysis
Analyzing a test run actually begins on the Test Complete dialog box when you finish running a test in Eggplant Performance Test Controller.
To indicate you want to analyze a test result, perform the following steps:
- On the Test Complete dialog box that displays when you finish running your test in Test Controller, selectFlag this test run for later analysis in addition to Save the results of this test run.
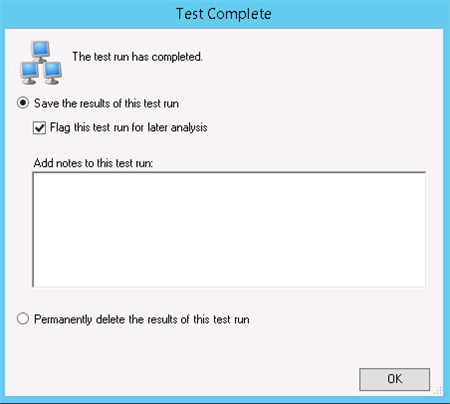
- Click OK to dismiss the Test Complete dialog box. You are still in the Test Controller application.
Continue to the next section for information about importing the test run you want to analyze and see the results for in Analyzer.
Importing a Test Run into Analyzer
Import the test run you want to analyze into Analyzer as follows:
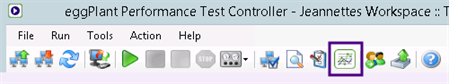
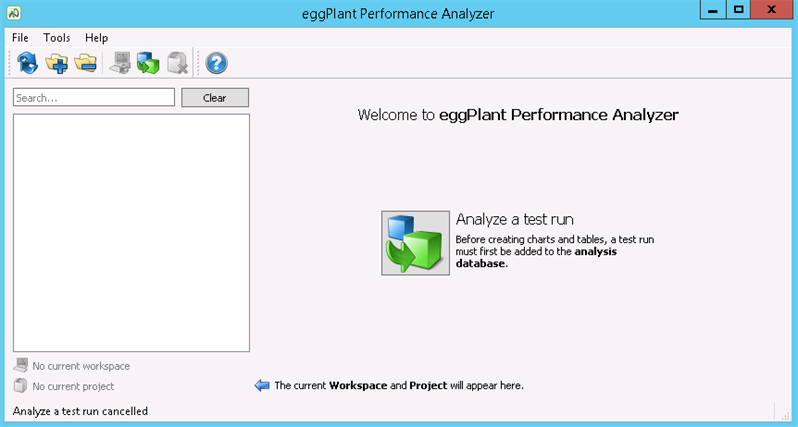
- Launch the separate Eggplant Performance Analyzer application by clicking the Analyzer button (shown highlighted in the sample screen above) in the Test Controller toolbar Analyzer opens with a Welcome pane.
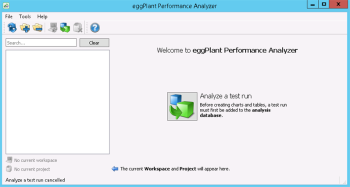
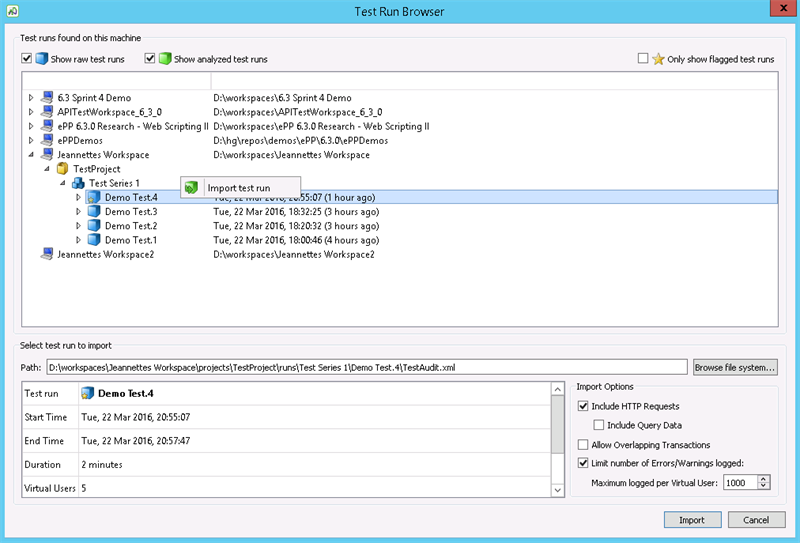
- Click the Analyze a test run button in the main window of Analyzer. The Test Run Browser panel opens showing you the test runs it found on the machine.

- Notice if the Show raw test runs or Show analyzed test runs options are selected and be sure Show raw test runs is selected.
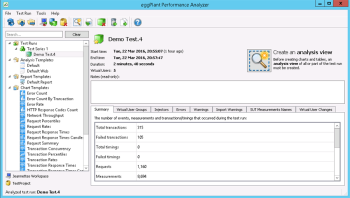
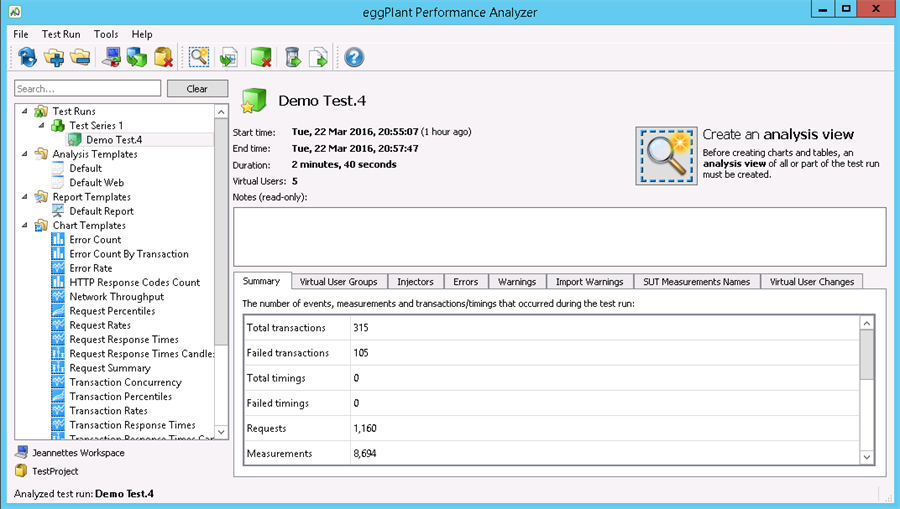
- Select the test you want to analyze, right-click, and choose Import test run from the pop-up menu. The Importing a test run dialog box opens to show you the progress of the import. When the import completes, the test opens in the Analyzer main window.
With your test run imported into Analyzer, continue to the next section for information about creating an analysis view.
Creating an Analysis View of the Test Run
To create an analysis view of your test run in Eggplant Performance Analyzer, perform the following steps:
- With the test you want to analyze imported and open in the Main window (as shown above), click the Create an analysis view button in the Main window. The Create an Analysis View wizard opens.
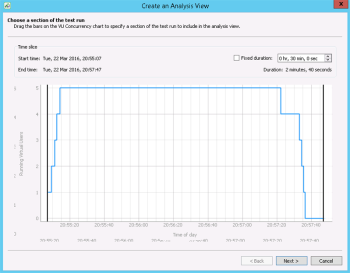
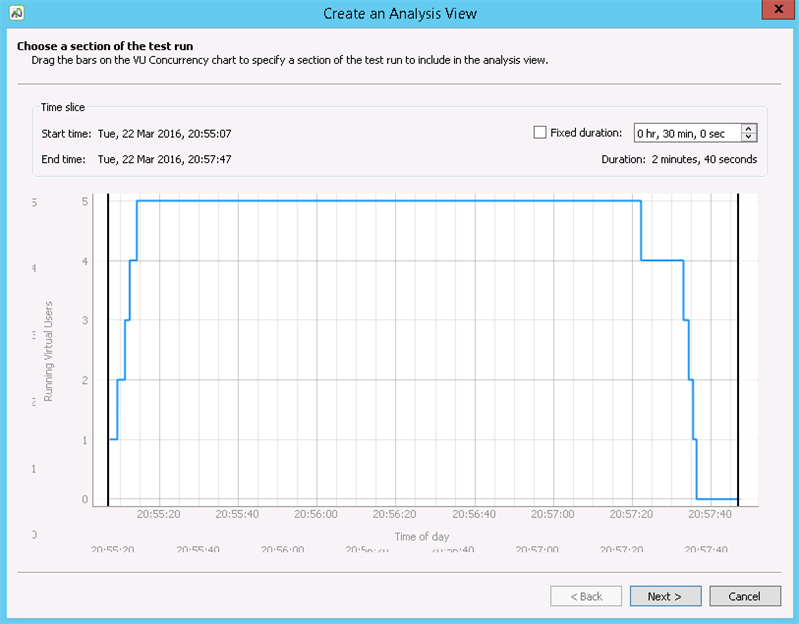
- Drag the bars on the VU currency chart to select the part of the test you want to include in the analysis view. In our example, we use the view of the whole test.
- Click Next.
- Proceed through the Create an Analysis View wizard, accepting the defaults to the Choose a name for the analysis view, and the size of the sample panel.
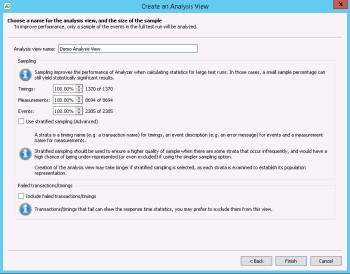
- Enter a name for the analysis view, accept the default values for the sample options, and click Finish. The Create an analysis view dialog box shows you the progress of the analysis view creation. Then the analysis view opens in the main Analyzer window.


Creating a Chart for the Analysis View
You can create a variety of charts for your analysis view in Eggplant Performance Analyzer.
To create a chart for your analysis view, perform the following steps:
- Under Test Runs in the left-pane, right-click your analysis view, and select New chart from the pop-up menu. The Create a chart wizard opens to the Choose a chart type panel.

- Select the type of chart you want. In our example, we create a time series chart to see how statistics changed over the duration of the view. Click Next. The Choose what will be displayed on the chart panel opens.

- Choose what you want to display on your chart. In our example, we chose to display concurrency information about VUs. Click Next. The Enter a name for the chart panel opens.
- Enter a name for your chart, check to make sure that the Display as a chart option is selected, then click Finish. Your new chart opens in the Analyzer Main window.


Creating and Viewing a Report
If you want to view your test results in a report, you can create reports in Eggplant Performance Analyzer in your choice of following formats: PDF, ODT, or HTML.
To create a report, perform the following steps:
- InAnalyzer, right-click your analysis view in the right-pane and selec tCreate report. The Create report dialog box opens.
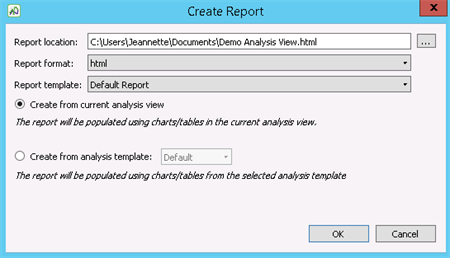
- Choose the location where you want to save the report, the format you want for your report, and whether it will be created from the current analysis view or a template. In our example, we create the report in html format from the current analysis view. Click OK to create the report.
- To view your report, navigate to the location where you saved it and open it. Below is what our example report looks like in html format.

That completes our quick start guide forEggplant Performance. For more detailed information about any of the topics covered, see the documentation for each application:

![]() Eggplantsoftware.com | Documentation Home | User Forums | Support | Copyright © 2022 Eggplant
Eggplantsoftware.com | Documentation Home | User Forums | Support | Copyright © 2022 Eggplant