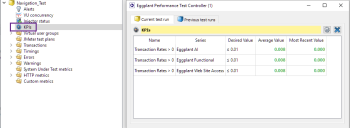
After you define a key performance indicator (KPI) collection for a test run in Eggplant Performance Studio, you can view that KPI collection on the relevant charts while a test is running. For instance, if you defined a KPI for a variety of transaction rates, it can be useful to see if these transaction rates exceed the limit that you defined while the test is running. For more information about creating KPI collections, see KPIs in Eggplant Performance Studio. Remember that KPIs represent the acceptable values for the statistics on which they have been set.
After starting a test in Test Controller, double-click the KPIs node in the Current test run section to view an at-a-glance summary of the KPIs defined for the running test. KPIs that meet their target criteria are displayed in green, and those that are failing are shown in red. This view is also available in the Previous test runs section for test runs that have completed.
If you view a chart that shows data relevant to a particular KPI (e.g. the Transaction response times chart, and you have a KPI defined with category Transactions and statistic Response Time), then the target KPI value is automatically plotted for easy comparison as a horizontal dash-dot line next to the appropriate series.
