Use the Reporting feature to design and create custom reports that show data collected from test results. You can add a variety of test result information to these custom reports. For detailed information about the data available from the tests you run on Eggplant Manager, see Viewing Eggplant Manager Test Results.
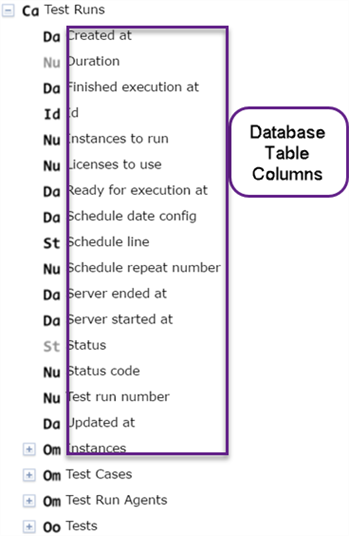
When creating custom reports, consider the selection items shown on the left side of the UI to be database table columns.

Certain database table columns are associated with higher level tables:
- Test Runs: A specific instance of running a set of scripts. A test run contains one or more instances of one or more scripts.
- Tests: A set of scripts that you run against a system under test (SUT).
- Instances: A specific instance, either manual or scheduled, of an attempted script run.
- Test Cases: Tests that contain BeginTestCase and EndTestCase commands to mark the beginning and end of any section of code within a script (or across scripts during a run). These marked sections of code function as test cases for purposes of gathering information. See Results and Reporting for more information.
- Test Run Agents: Agents make your Eggplant Functional instances available to Eggplant Manager for testing. See Working with Agents for more information.
Each item on the left side of the UI is labeled with a specific Report Code. See Report Codes to understand a data column's data type and the relationship between a data column and its associated table. This information helps you understand the data types and the associations between data and the data tables when creating new reports.
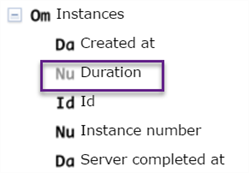
If you see a report code that is dimmed, as marked with the rectangle in the following screen shot, it means that the value is derived. For example, the value might be a duration value that is derived from subtracting started at from completed at.

After creating single custom reports by using the instructions shown in Creating Single Custom Reports, use the instructions shown in Creating Multi Reports to add multiple single reports to a Multi report that you can share with others.
Creating Single Custom Reports
Complete the following steps to create a single custom report. Click the Preview button to view your progress while you create your report.
- Select Reporting > Edit Reports.
- Click Edit Report to modify an existing report or New Report to create a new report.
When creating a new report, Eggplant Manager prompts you to select a Report Category from a drop-down list. Click Create after you make your selection.
- Review the data column names shown on the left side of the UI and make a list of the data columns you want to include in reports. Note: The data column names and tables change with the report you select.
- Drag the data columns from the left side of the UI into the Columns box. As you populate the Columns box, Eggplant Manager populates the Query box with the table associated with the data column. Note: The contents of the Columns box shows the table name followed by the name of the data column name.
- Rearrange the data columns by selecting the ones you want to move and using the arrows to move the data columns to match the order you want in your report.
- Use the Remove Selected button to remove any unwanted data columns.
- The Eggplant Manager application populates the Query fields as you select the columns. As you create your queries, use the Add Rule button to add and configure data queries that qualify the data that you want to present in your reports. Note: If you create any unneeded rules, use the Remove button to remove them.
- Add information related to the layout of the report.
The layout selections consist of an Order and whether the order is ascending or descending in value. If you want to limit the length of a report, set the Limit value. The zero value means that there is no set limit.
- Add Groups to create a physical separation in the table for each group in your report.

- Click Add Group or Remove Group to manage the groupings you need to create the physical separations you want in your report.
- Group: Configure the group selections to configure the physical separations you want in your report.
- Show: Select the statistics, such as Count, Total, Minimum, Maximum, Average, and others, that you want included in your report data. For example, you might make the following selection to show the Minimum, Maximum, and Average values for the Duration column over time.
- Set your report to display as either a table or a chart using the drop-down menu.
Display As Table
- When choosing Table Options, select Expand Data Down for the table to show a hierarchy (parent-child) of data in the report.
- Select Collapse Data Up for the table to show data that align better as a one-to-one relationship.
Display As Chart
- Select the best type of chart for the selections chosen earlier:
- Line Chart: Produces a line graph showing values connected in order.
- Bar Chart: Produces a chart showing rectangular bars with lengths proportional to the values that they represent.
- Pie Chart: Produces a chart that shows percentage values.
- Column: Choose the data column to include in the chart.
- Index by: For line charts or bar charts, select the x-axis values to use.
- Click Preview to view your finished report.
Sharing Reports
There are various tools available for sharing or reusing existing reports.
Exporting and Importing Reports
To export a report, do the following:
- Click Reporting> Edit reports.
- Click Export.
- Capture the information shown in the Report Export dashboard. You can paste this captured content into Eggplant Manager using the import a report steps shown below.
To import a report, do the following:
- From a different instance of Eggplant Manager, click Reporting > Edit reports.
- Click Import.
- Past the report information you captured from a report export into the Report Import dashboard.
- Click Import and follow the interactive instructions to create a new report.
Cloning a Report
You might want to use a cloned copy of an existing report for experimenting with other report changes. To clone a copy of an existing report, click the Clone button and follow the interactive instructions. See Cloning an Existing Test for more information.
Rolling Back to an Earlier Report Version
As mentioned earlier, Eggplant Manager saves new or existing report changes automatically when you change the selected report, navigate away from the reporting feature, or export the current report. The Eggplant Manager application includes a way to retain and reuse various saved versions of a report. To view an earlier version of a report, do the following:
- Click the Rollback button.
- Select the report version you want to view.
- Click the Rollback button and Eggplant Manager loads the selected report version.
Creating Multi Reports
Use this option to add multiple single reports into a single PDF file for download:
- Select Reporting > Multi Report
- Do one of the following and follow the interactive instructions to select the report option you want to use for this edit:
- Select a Multi Report, then click Edit Multi Report to edit an existing report.
- Click Create New Multi Report to add a new Multi report.
- Click Download PDF to download and view a PDF version of a selected report.
- Click the Edit Reports link to begin modifying the selected Multi report.
- Click Add Report to add new reports to the dashboard.
- While editing a Multi report, click the remove button (the red X) to remove a report from a dashboard.
- While editing a Multi report, use the mouse to select a report and drag it up or down and drop it in the desired location within the Multi report.
- Click Stop Editing to save your work.
Running Reports
Use this feature as a quick and easy way to view your existing reports. This feature shows you a snapshot of the latest test results.
To use this feature, do the following:
- Select Reporting > Runner.
- Select a report from the categorized list of reports in the left column to see the report results. The resulting report shows you a snapshot of the latest report. Note: Although the list of reports shown here contain the latest collected test data, the listed reports contain static data. To refresh a report, click a report from the categorized list of reports in the left column .
- The following options are available at the top of the page to view and share your report:
- Click Share Link to display your report.
- Click Get PDF to generate a copy of your report as a PDF.
- Click Get CSV to download a copy of your report as a .csv file for further analysis using a tool such as Microsoft Excel.