Coverage reporting is one of the primary functions of Eggplant AI. The Coverage Report tab in Eggplant AI shows you how much of your model has been visited during test runs. You can use these results to adjust weighting and other variables in your model to ensure appropriate coverage to areas that are most important to you.
The Coverage Report tab in Eggplant AI
Viewing Coverage Types
The Coverage Type drop-down menu lets you select how much model path detail you want the Coverage Report to include. In addition to the default Coverage Types (All Nodes, All Pairs, Extended, Full Exploratory), you can configure custom Coverage Types if you have the administrator privileges. For more information on configuring Coverage Types, see EAI Administration.
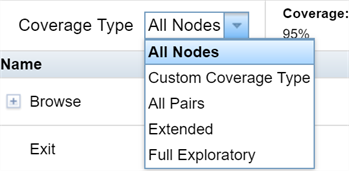
Selecting how much model path detail to include
The Coverage Type you select sets the number of consecutive states and the number of consecutive actions used in the calculations. When you change this setting, Eggplant AI recalculates the coverage metrics based on the model's run data.
For example, if you set the Coverage Type value to Extended, Eggplant AI calculates all of the possible paths through your model that consist of sequences of three actions or of three states. It also calculates the associated metrics for these paths.
The following diagram shows an example of a set of state paths with a Coverage Type of Extended selected:
A set of state paths with a Coverage Type of Extended selected
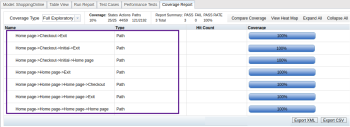
The following diagram shows an example of a set of action paths with a Coverage Type of Full Exploratory selected:
A set of action paths with a Coverage Type of Full Exploratory selected
The coverage metrics show you the coverage percentages of the model you have loaded, using the number of states, actions, and paths covered by a test divided by the possible states, actions, or paths that could have been covered. To see a visual comparison of the model path coverage percentages for the different coverage depth settings, click Compare Coverage.
Cross Type Values for Parameters
The Coverage Report provides you with information about parameter coverage. When viewing the report, a Cross type represents a combination limited to two parameter values being used by an action within a model. Instances of parameter usage appear as type bin, and are located beneath their associated Cross type in the report. Note that the Cross or bin types are not temporal actions or states as discussed earlier. The following example diagram shows method parameter values of cash or credit combined with coupon parameter values of 1, 2, or 10.
Method parameter values of cash or credit combined with coupon parameter values of 1, 2, or 10
When Eggplant AI processes Cross types, it may consume a lot of memory, therefore additional limitations apply beyond just handling the upper limit of two parameter values. When processing a Cross type, Eggplant AI considers only three groups of values within the value bins: the minimum value, the maximum value, and the combined middle values.
For example, the following diagram shows method parameter values of cash or credit combined with a minimum value of 1, a maximum value of 9, and a set of middle values that range from 2-8.
Method parameter values of cash or credit combined with a minimum, middle range, and maximum parameter value
Submodel Coverage
The Coverage Report also shows coverage information from submodels that are enabled in the test runs. There are multiple ways to view the coverage of a submodel in Eggplant AI.
- Via the parent model: From the Coverage Report tab, navigate down to the state containing the submodel by expanding it in the Name column.
- Via the submodel itself: Load the submodel and view the coverage of actions and states in the Coverage Report tab.
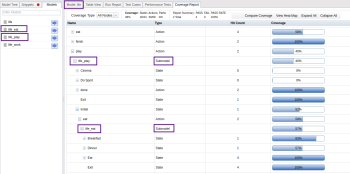
The following sample report shows the coverage of actions and states associated with models and submodels included in the parent model.
When calculating the total coverage of the parent model, Eggplant AI also takes into account the coverage of all the available submodels. In this example, the parent model is called life, and it has a submodel called life_play, which has a submodel of its own called life_eat. Eggplant AI also takes into account the number of times the model and submodels were executed. The more times you execute the model and its associated submodels, the higher the likelihood of the coverage there is.
Additional Coverage Report Information
The Report Summary shows you the total number of tests that ran, the number of tests that failed, and includes the test pass rate.
To see a visual representation of the parts of a model that were hit during a test run, click View Heat Map. You might need to expand the Coverage Report pane to access the View Heat Map button.
The View Heat Map button in Eggplant AI. Click image to view larger.
The heat map can show coverage or failures. Choose the report you'd like to see with the drop-down menu in the main Eggplant AI toolbar. You can also turn on the heat map from this menu.
In the Coverage context, components in your model that have been hit the most display in dark blue. Components that have been hit fewer times display in lighter blue. Components that haven't been hit display in gray. To remove the heat map view from the model, click Remove Heat Map on the Coverage Report tab.
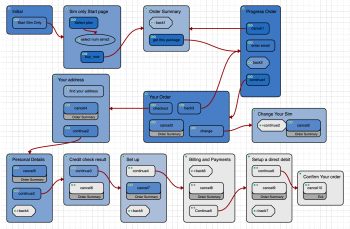
The Eggplant AI Model tab view, shown with a Coverage heat map overlay. Click image to view larger
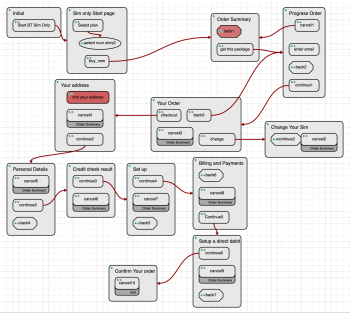
In the Failures context, actions that fail during testing display in red.
On the Coverage Report tab, you can expand or collapse the states in your model to see their related actions and the coverage of those actions in the model. States can be expanded or collapsed in the table representation of the model, or by clicking Expand All or Collapse All.
Export the Coverage Report in XML or CSV format by clicking the appropriate button at the bottom of the report tab.


