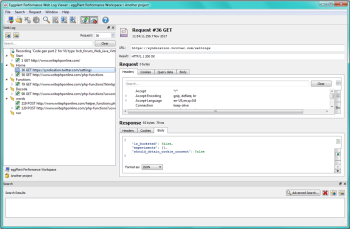
The Web Log Viewer provides details about web recordings you make in Eggplant Performance Studio. You can view recordings and replays within the viewer. A replay is a recording that has been made automatically by a virtual user (VU) during a test.
The Web Log Viewer opens a recording or replay in the context of a virtual user type. The generation rules associated with that VU type are applied to the web recording. You can also compare a recording with a replay using Comparison Mode.
Launch the Web Log Viewer
There are several ways to open the Web Log Viewer.
From the Project Tree
- Open the Recordings folder.
- Right-click the recording you want to view, then select View and either View Recording or View Filtered Recording. A filtered recording shows data from hosts you choose to include in the Apply host filter window. An unfiltered recording shows data from all hosts involved in the recording.
From the Tools Menu
- Go to Tools > Web Log Viewer.
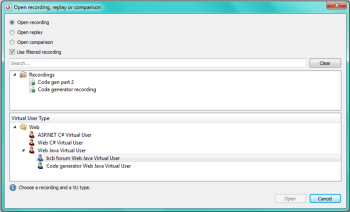
- In the Web Log Viewer Window, click the folder button or go to File > Open recording, replay or comparison.
- Choose a recording to open and a VU type.
From the Recording Menu
- Go to Recording > View and select either View recording or View filtered recording.
From the Generation Rules Wizard
- Click View Recording.
Web Log Viewer Toolbar
The toolbar gives you quick access to the following options in the Web Log Viewer.

Switch current workspace/project: Close the project that's open and open another.
Open recording, replay or comparison: Open a recording.
Close recording: Close the current recording.
Close replay: Close the current replay.
Search recording: Opens the New Search window. Searches defined here apply to the whole recording.
Search current request: Opens the Quick Search window, which provides search options in the given request:
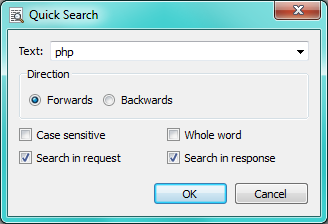
Quick Search options in the Eggplant Performance Web Log Viewer.
Find previous/Find next: Find the search term.
Show request/Show response: Toggle the Request and Response panes open or closed.
Web Log Pane
The Web Log appears in the left column of the Web Log Viewer window. It displays the transactions you defined in the recording, with the HTTP requests that make up each transaction. You can collapse and expand all of the transactions in the log. Use the Request field to jump between HTTP requests, either by using the up and down arrows or entering a number in the field. Use the Search field to search for specific character strings in the Web Log.
Request View Pane
The Request View pane is the largest portion of the Web Log Viewer window. When you select a request in the Web Log pane, the URL the request was sent to displays in the URL field, and the HTTP response (or status) code for that request displays in the Result field.
Request
The Request section of the Request View pane displays the selected request from the Web Log pane in more detail. It also displays the size, in bytes, of the selected request. This section has four tabs:
Headers: A list of the headers sent by the client when requesting the resource. Headers can be displayed in Table view, Text view, or Hex view.
Cookies: Displays any cookies sent as part of the request. Cookies can be displayed in Table view, Text view, or Hex view
Query Data: Displays POST and Query data sent as part of the request. Query data is displayed in Key=Value pairs, as is POST data where appropriate. Query Data can be displayed in Table view, Text view, or Hex view
Body: Displays the body of the request. The Body can be displayed in Formatted view, Text view, or Hex view. The format choices available in Formatted view are CSS, HTML, JSON, XML, Javascript, Plain text, or URL encoded form.
Response
The Response section of the Request View pane displays the size of the response in bytes and the amount of time the response took in seconds. This section has three tabs.
Headers: A list of the headers returned by the web server as a result of the request. Headers can be displayed in Table view, Text view, or Hex view.
Cookies: Displays any cookies received in the response. Cookies can be displayed in Table view, Text view, or Hex view.
Body: Displays the body of the response. The Body can be displayed in Formatted view, Rendered view, Text view, or Hex view. The format choices available in Formatted view are HTML, XML, JSON, Javascript, CSS, Plain text.
Viewing Transactions
You also can select a transaction in the Web Log panel. The Request View pane displays either a snapshot of that particular screen or a list of the requests that took place during the transaction. At the top of the Request View pane, the start and end dates/times for the transaction display, as well as the duration of the transaction.
Search Pane
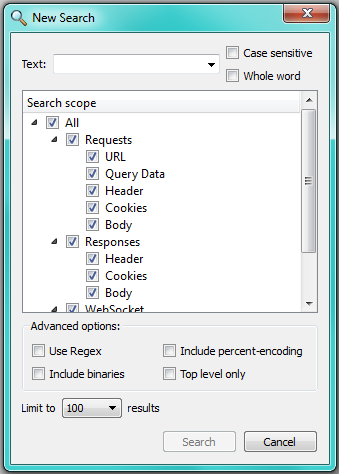
The pane at the bottom of the Web Log Viewer window displays detailed search results. Click Advanced Search to define search parameters, as shown below:
Comparison Mode
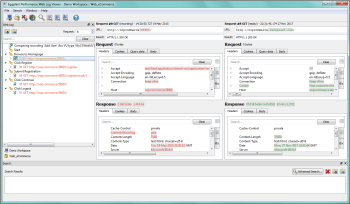
You can compare a replay of a test with the original recording in the Web Log Viewer. Comparison Mode shows the recording and replay side by side and highlights the differences automatically. Comparing recordings and replays can be useful for debugging scripts.
Follow these steps to launch Comparison Mode:
- From the main Web Log Viewer window, go to File > Open recording, replay or comparison. The Open recording, replay or comparison window opens.
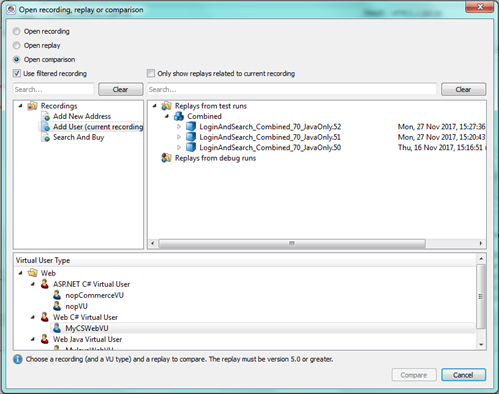
- Select the Open comparison radio button. Use the checkboxes to choose whether or not to use the filtered recording, and whether or not to limit the comparison to replays related to the current recording.
- Select a recording to compare from the Recording tree.
- From the Replay tree, select the replay to compare to the recording.
- Choose the VU to use from the Virtual User Type tree.
- Click Compare. The Web Log Viewer window display changes to Comparison Mode. Differences between the replay and recording are highlighted automatically.
Resetting the Window Layout
You might run into a situation that requires you to set the Web Log Viewer window layout to its default state. Do the following:
- Select Window > Reset window layout.
- Click Yes when asked if you want to reset the application to its default layout.
Completing the above steps sets the toolbar back to its default appearance. It also docks the Web Log and Search sections back to their default state and location. After resetting the layout, Web Log Viewer window appears as it did right after you installed it and opened it for the first time.
