Use Dashboards to quickly get an overview of your modeling and test execution activities as well as to analyze test cases in Eggplant DAI. Dashboards help you determine the status of your project's progress, e.g., whether your test cases have all been hit, percentage of passed vs failed test cases, so on and so forth. There are two types of dashboards in Eggplant DAI:
- Model Dashboard provides a high-level view of the various aspects of testing a model in widgets format as described below.
- QA Summary lets you customize a dashboard to get an overview of your test cases for a particular period.
Launching the Dashboard
There are different ways to launch the Dashboards menu depending on which part of the UI you are in. To launch the Dashboards menu:
- From the Modeler interface, click the
 button in the top right corner of the toolbar.
 - From the DAI UI, click the Dashboards menu on the left.
To get started, use the model selector drop-down list on the top-right of the page to select a model for which you want to see the dashboard.
Model Dashboard
The following widgets make up the Model Dashboard:

Model
The Model widget displays a donut chart that shows the number of actions present in the selected model, as well as which of those actions have snippets attached (also known as Automated in the widget).

The table below the chart provides an overview of how many of your actions and states have snippets attached. This information can help you determine how much more work is required to fully connect the model to Eggplant Functional. Click anywhere on the widget to return to the Modeler and load the current model. See Working with Models for more information on using models in Eggplant DAI.
Coverage
The Coverage widget displays a bar chart that shows a comparison of all coverage types in a model, along with the coverage percentage for the available coverage types. Click anywhere on the widget to switch to the Coverage Report in Insights.

Run Report
The Run Report widget displays a donut chart that represents the results of test runs for the selected model. When you hover your mouse over the chart, a tooltip displays the number of runs along against the color-coded statuses.
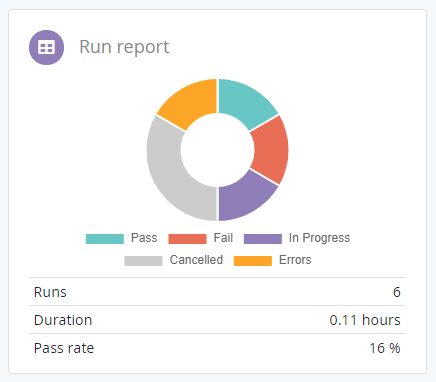
The Run Report widget provides the following information:
Pass: The total number of passed test runs.
Fail: The total number of failed test runs.
In Progress: The total number of incomplete test runs.
Canceled: The total number of canceled test runs.
Errors: The total number of runs with errors.
Runs: The number of test runs from the most recent version of the model from the database.
Duration: The total time taken for the test runs to complete.
Pass rate%: The overall passing percentage for the test runs.
Bug Hunting
The Bug Hunting widget displays the top three failed actions and tags that caused the selected model to fail. Note that the failure data is available only if either an action or an associated tag in your model failed during a test run.

See Using Tags to learn more about how tags can be useful during debugging. Click anywhere on the widget to navigate to the full Bug Hunting report in Insights.
Test Cases
The Test Cases widget displays a donut chart that represents the total number of passed test cases versus the test cases that have not been run from the selected model. Click anywhere on the widget to navigate to the Insights page. When you hover your mouse over the chart, a tooltip displays the number of test cases that have passed or haven’t run yet.

The Test Cases widget provides the summary of:
Test cases passed: Indicates the number of test cases that passed out of the total number of test executions.
Not yet run: Indicates the number of test cases that have not been run yet.
Test cases: Displays the total number of test cases available in the model.
Total hits: Displays the number of times the test cases were hit during the model execution. Test case hits are represented by test ID numbers for every instance of a model run where the test case definition was matched.
QA Summary Dashboard
Use the QA Summary dashboard to get an overview of your recent testing activities for directed and exploratory test cases. You can customize it to display both graph and chart type widgets for a particular time period using the date range filter. Directed test cases are specific user journeys in your model runs. You can define them on the Test Case Builder tab in the right pane of the Modeler UI.
The following widgets make up the QA Summary Dashboard:
- Test Results Record
- All Runs (Exploratory/Directed)
- Test Case Completion (Directed)
- Failure Type
- Coverage
- Test Breakdown

Specify a date range by selecting one of the following options:
- Today/Yesterday: Use for generating QA Summary for today or yesterday's test case data.
- Last 3 Days/Last 7 Days: Depending on your selection, generates a dashboard for the last 3 days or 7 days worth of QA Summary of the current week.
- Custom Range: Specify the From and To dates to generate summary for the specified date and time. If you don't define the To date, Eggplant DAI uses the current date for that value.
By default, the dashboard view is set to display data for the last 7 days if no date is specified.
Test Results Record
The Test Results widget displays a bar graph for the total number of runs for the selected date range. It captures information about all your model runs as well as the directed test cases. The status and type of runs are color-coded for easy reference.
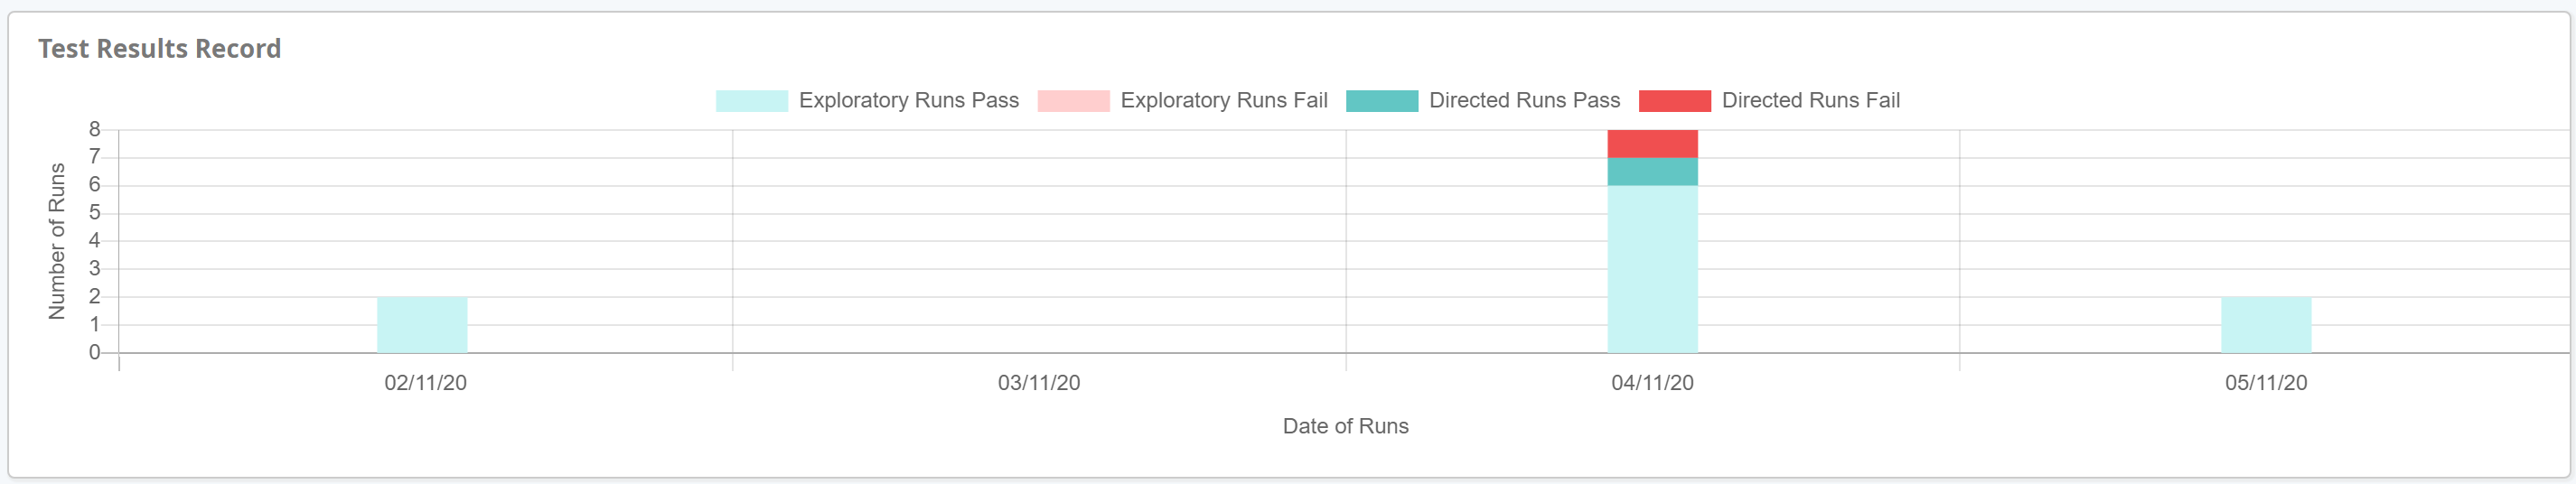
The test result status is represented by color codes, where light green bars indicate passed test cases, dark green bars indicate passed directed test cases and red indicates failed test cases. The label on the vertical axis represents the directed test cases and the horizontal axis shows the number of runs.
All Runs (Exploratory/Directed)
The All Runs widget displays a color -coded donut chart representing how many of the model’s test cases have been executed for both exploratory and directed test cases.
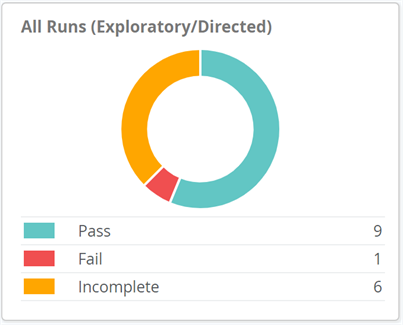
The All Runs widget provides the following information:
Pass: The total number of passed test runs.
Fail: The total number of failed test runs.
Incomplete: The total number of incomplete test runs which either resulted in errors or ended abruptly for various reasons.
Test Case Completion (Directed)
The Test Case Completion widget shows the proportion of directed test cases that exist for the selected model that have been run to pass or fail. The number of test cases based on its completion status is presented below the color-coded donut chart.
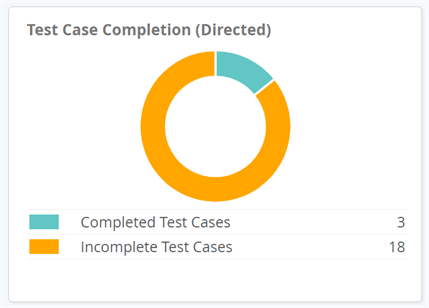
- Completed Test Cases: The total number of successful test cases. If a test case has been run 10 times, it'll still be counted as one completed test case.
- Incomplete Test Cases: The total number of directed test cases that are incomplete or have not been attempted yet.
Failure Type
The Failure Type widget displays a color-coded donut chart with failures from both Directed and Exploratory test runs.
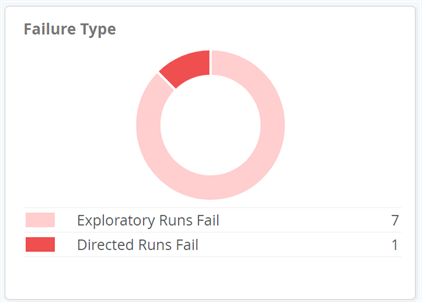
The Failure Type widget provides the following information:
- Failed Exploratory Runs: The total number of failed exploratory runs when running exploratory tests from both the Modeler tab and Runners tab. The failed exploratory runs are color-coded in light pink.
- Failed Directed Test Cases: The total number of directed test cases that failed when running tests from the Test Cases tab, which is color-coded in red.
Coverage
The Coverage widget represents the coverage of all the runs from a latest version of the model in a color-coded donut chart. Coverage represents what percentage of your model has been visited during test runs. During a test run, Eggplant DAI calculates coverage for possible paths based on various combinations of sequences of actions in the model. Note that the maximum coverage achievable is not always 100%.
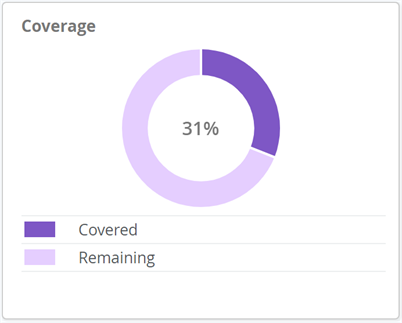
The Coverage widget provides the following information:
- Covered: The percentage of tests covered for all the runs in this model. It is color-coded in purple for your reference.
- Remaining: The percentage of tests that are yet to be covered, i.e., remaining paths of a model that have not been hit during the test run.
For more information on how to view the total coverage for your model, see Coverage Reporting in Eggplant DAI.
Test Breakdown
The Test Breakdown widget shows the breakdown of passed versus failed directed test cases in a bar chart format.
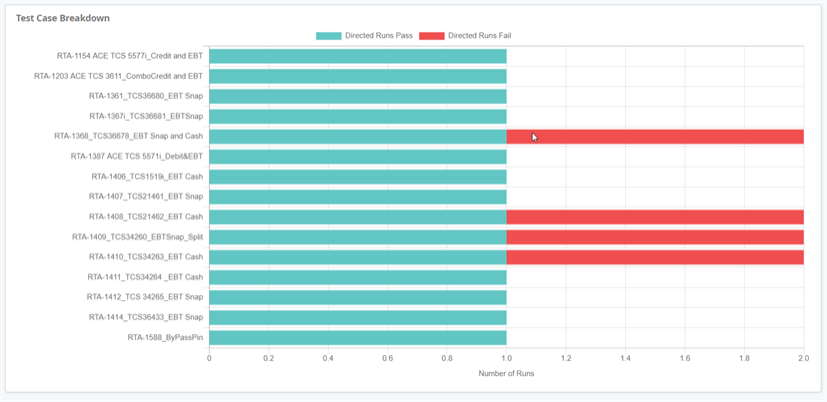
The status of the runs is represented by color codes, where green bars are passed directed test cases and red indicates failed directed test cases. The label on the vertical axis represents the directed test cases and the horizontal axis shows the number of runs.
![]() Eggplantsoftware.com | Documentation Home | User Forums | Support | Copyright © 2022 Eggplant
Eggplantsoftware.com | Documentation Home | User Forums | Support | Copyright © 2022 Eggplant