Advanced Reporting with Insights
Eggplant AI Insights collects data from your model runs to make it easier to analyze and access. Reporting in Insights takes advantage of information from the Coverage Report and pulls additional information to help you evaluate your release readiness.
- From the Eggplant AI toolbar, click the Home or Designer button > Insights tab to launch Insights in a new browser tab.
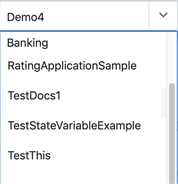
- Use the drop-down menu at the top of the Insights page to choose which model to analyze.
The Insights page is broken down into the following reports:
- Coverage: Helps you determine how much more testing is needed to reach 90% coverage.
- Bug Hunting: Shows during which action the test failed.
- Test Cases: Provides a summary of test cases.
- Run report: Includes a summary of the test runs that were run against the models you're interested in.
Coverage
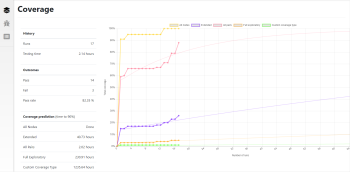
The main chart in the Coverage page shows the coverage percentage against the number of runs for the default coverage models (All Nodes, All Pairs, Extended, and Full Exploratory) as well as the custom coverage models that are available in the Coverage Report tab of the main Eggplant AI UI. Real data is shown in bold, with points highlighted. The lighter extension of this line indicates the predicted evolution of the coverage.
The information below shows data for the latest version of the selected model:
History
Runs: The number of completed test runs for the selected version of the current model.
Testing time: The total duration of all test runs.
Outcomes
Pass: The number of passed test runs.
Fail: The number of failed test runs.
Pass rate: The percentage of test runs that have passed.
Prediction
Remaining time to 90% coverage: This is an estimate of how long it will take to reach 90% coverage for each coverage model, based on the actual results plotted in the graph. If 90% coverage has been achieved, this field says Done; otherwise, the number of hours remaining until 90% coverage is listed for each coverage type.
Bug Hunting
Click the Bug icon on the left side of the Insights screen to load the Bug Hunting report. This screen allows you to see where failures happened in a model without opening test log files.
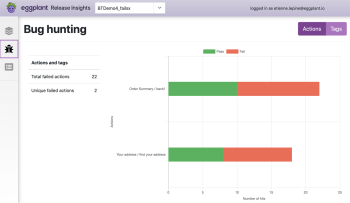
The Bug Hunting report in Actions context.
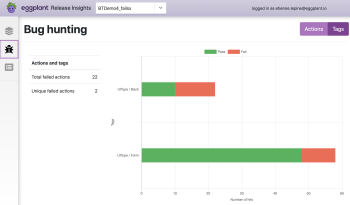
The Bug Hunting report in Tags context.
The text chart on the left side of the Bug Hunting screen shows how many discrete actions have failed. In the examples shown above, 22 failures occurred across two actions.
The bar chart on the right side of the Bug Hunting screen shows either Actions or Tags. In the Actions context, the chart shows the successes and failures for each action with at least one reported failure. In the Tags context, the chart shows the number of successes and failures associated with tags that are defined for your model.
Test Cases
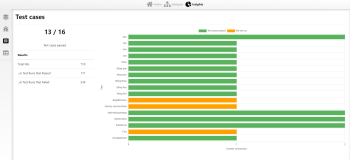
The Test Cases report provides an at-a-glance status report for your defined test cases. Click the list icon in Insights to open this report.
The numbers directly below the Test Cases heading show how many test cases passed out of the total number of test cases. The Results text on the left shows how many times a defined test case path is selected during model execution.
The bar chart on the right side of the screen shows how many of your test cases passed, and how many haven't been tested yet. The vertical axis of the chart shows test case runs by tags defined in the Test Case Builder. The horizontal axis of the chart shows the number of test cases that ran.
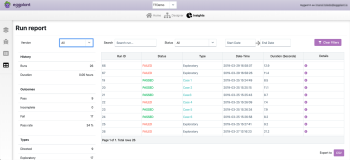
Run Report
Click the Run Report icon on the left side of the Insights screen to load the report and view the tests that have been run against the selected model. In addition, you can view the following information:
- View tests that have been run against your model.
- Determine which of your tests have passed, failed, and incomplete.
- Download log files.
- View steps for the selected model execution (also called test run) in steps.
The display on the left side of the Run Report shows the following data:
Version
- All: Select to show all test runs.
- Latest: Select to show the test run from the most recently saved version of your model.
History
- Runs: The number of runs for this version of the model.
- Duration: The total duration of the testing run against the current model.
Outcomes
- Pass: The number of passed test runs.
- Incomplete: The number of incomplete test runs.
- Fail: The number of failed test runs.
- Pass rate: The percentage of test runs that have passed.
Types
- Directed: The number of directed tests run against the current model.
- Exploratory: The number of exploratory tests run against the current model.
The display on the right side of the Run Report provides the following filtering options:
- Search: Enter the ID to sort the results based on the value you enter. For example, if you enter 5, it'll not only display the Run ID that contains the value 5 but also the duration with a value of 5 in the Duration(Seconds) column.
- Status: Choose from the filter options: All, Passed, Failed, or Incomplete test status, to view all, passed, failed and incomplete test runs respectively.
- Start Date and End Date: Sort by date or date range (Start Date, End Date). If you don't define the End date, Eggplant AI uses the current date for that value.
The table view on the right side presents the following data based on the filters applied in the previous section:
- Run ID: Displays the unique ID of the test run. It starts at one when you first install Eggplant AI and increments with every test run.
- Status: Displays the outcome of the test run based on your filter criteria. That is, you can filter the results by All, Passed, Failed, or Incomplete statuses.
- Type: Displays Exploratory for model executions and for directed tests, the test case name is shown.
- Date-Time: Displays the date and time when the test was run.
- Duration (Seconds): Displays the duration of the test runs in seconds.
- Details: Click the information icon to view additional summary such as:
- Model details: Provides a summary of the test runs for the selected model. The information shown here is similar to the information shown in the Run Report tab.
- Logs: Displays the logs of the test run similar to the log that appears in the console in Eggplant AI UI when you executed a model. Click Download to download the logs.
- Steps: Displays the sequence of the user journey for the selected test run.
- Coverage: Displays the coverage percentage for the selected test run along with the number of states and actions contributing to the coverage of the test run.
- Export to: Click this button to export run reports in CSV format.
