Connection Settings
At this stage, the Add Monitors wizard starts to define monitoring profiles. Each measurement template (selected on the previous wizard page) will add measurements to a particular monitoring profile, which uses a certain technology type to collect the measurements.
For example:
-
- If you chose the Java measurement template, the measurements it contains will be added to a JMX monitoring profile, because Eggplant Performance will use JMX to collect the measurements.
For each monitoring profile that doesn't already exist, the Connection Settings page of the wizard will be shown.
Note: For the definitions of the different monitoring concepts present in[General.EpP%] [General.Studio%]", refer to: Introduction to monitoring.
-
The Connection Settings page of the Add Monitors wizard appears:
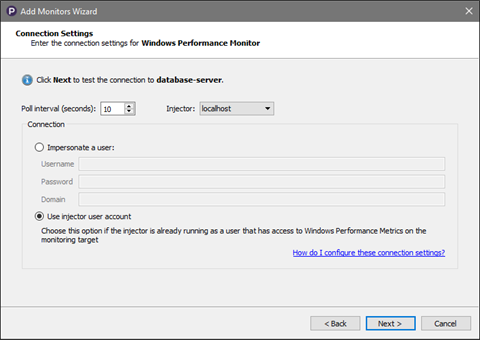
This page is different for each different monitor type. For more information on how to configure the connection settings, refer to the following:
The parts of this page that are common to every monitor type are as follows:
Poll interval (seconds): the interval at which measurements will be collected during a test.
Injector: when this monitoring profile is added to a test (and also during the connection test on the next page), it will run on the injector selected here. It is important that the monitor process is able to connect to the monitoring target from the injector machine on which it is running. The monitor will use one of the engine TCP ports from the range defined on the Basic Settings tab as described in Configuring Static Injector Families. Therefore, the range must be large enough to accommodate both engines and monitors if a monitor is added to a test.
See also: Monitoring architecture diagram.
Note: This page also appears on the Monitoring Profile view, when a monitoring profile item is selected in the Workspace tree.
- Click Next. The Testing the connection page of the Add Monitors wizard appears:
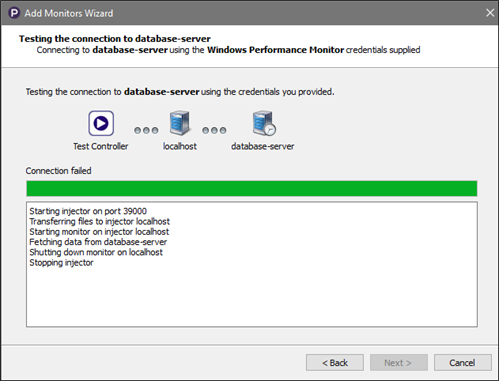
This tests the connection from the injector machine to the monitoring target, using the credentials supplied on the Connection Settings page.
Important: If the connection test fails, you will not be able to proceed with the Add Monitors wizard. Make sure that the monitoring target and the injector are both running and accessible, and allow the connection through any firewall that may be present.
Next step in the wizard: Select instances
![]() Eggplantsoftware.com | Documentation Home | User Forums | Support | Copyright © 2022 Eggplant
Eggplantsoftware.com | Documentation Home | User Forums | Support | Copyright © 2022 Eggplant