The Eggplant Manager dashboard provides an overview of how your tests are doing. You can investigate any issues that are cropping up and analyze results over time through the information presented here.
Navigate to the Eggplant Manager dashboard by clicking Dashboard in the main menu bar of Eggplant Manager. The Eggplant Manager dashboard is typically the first screen you see when you log in to Eggplant Manager.
If you added a custom report to the dashboard using dashboard modification tools, it might only show data collected before opening the dashboard. Click a report's Refresh button to update the data for that report.
Components of the Eggplant Manager Dashboard
The Eggplant Manager Dashboard comprises the following sections:
- Test Case Times Table
- High Level Test Health Table
- Test Run Instance Pass/Fail
- Recent Test Runs
- Recent Log Errors
- Test Run Instance Average Duration
To get started, click the Edit Reports link in the upper right of the Dashboard.
Removing a report: Click Remove (red X icon) in the upper right to remove a report.
Adding a report:
- While in edit mode, click the Add Report button in the upper right to open the Add Report to Dashboard dialog box.
- Select the report you want to add from the Report drop-down list.
- Click Submit to finish adding the selected report to the dashboard.
A report that you add to the dashboard only shows data collected before opening the dashboard. Click a report's Refresh button to update the data for that report.
Rearranging a dashboard:
- Click the top of the green border for a report you want to move.
- Drag the report up or down to the preferred location.
- Release the mouse to place it in the new location.
Saving your work: Click the Stop Editing link after you finish your edits to save your changes.
Test Case Times Table
The top section of the Eggplant Manager dashboard displays a graph showing the durations of recent tests. You can also view the results of sections of a test, nestled between BeginTestCase and EndTestCase commands. Select the Test and specify the Number of Runs you want to chart. You can choose whether or not to Include Failures in the graph.

High Level Test Health Table
This section of the Eggplant Manager dashboard provides a quick visual analysis of the most recent run history for all tests in Eggplant Manager. You can sort these results by Test Group, as well.

The High Level Test Health Table provides the following information:
-
Last Run: This column shows a circle indicating the status of the most recent test run. Statuses include:
 = Success.
 = The test ran successfully but is considered unstable because it generated warning messages.
 = Failure.
 = The test is currently running.
 = The test did not run correctly because an error was encountered.
 = There is no information for this test (because the test was created but has not yet been run).
 -
Trend: This column uses weather icons to provide a general overview of the test's recent performance. The trend status is determined by the success and failure rate for that test over the previous five runs.
 = No failures for the past five runs.
 = One failure in the past five runs.
 = Two failures in the past five runs.
 = Three failures in the past five runs.
 = Four failures in the past five runs.
 = All five most recent runs were failures.
 = No information is available for this test (because the test was created but has not yet been run).
 -
Test: This column shows the name of the test.
-
Last Success: This column shows the date and time of the last successful test run.
-
Last Failure: This column shows the date and time of the last failed test run.
-
Last Duration: This column shows the duration of the last test run.
You can click on a test (anywhere in the line for the test) to go to that test's specific page where you can see more detailed information as well as make any changes to the test.
Test Run Instance Pass/Fail
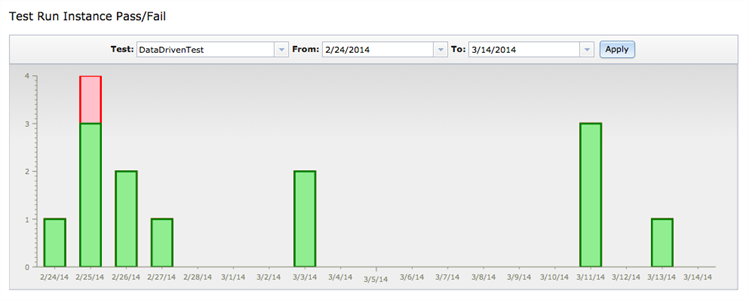
The Test Run Instance Pass/Fail section generates a graph of a test's success and failure rate over time. By default, this chart shows the most recent test that has run. However, you can use the fields at the top of the chart to view whichever test you want as well as change the time frame that the chart displays.

After you select new options in the Test, From, or To fields, click Apply to show the new data on the chart.
Recent Test Runs
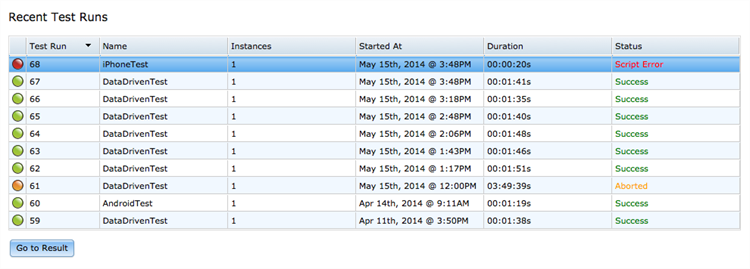
The Recent Test Runs section lists all of the most recent test runs. The table includes the run instance number, name of the test, number of instances run, start time for the run, duration of the test run, and result status.

To see the full results for a specific test run, select the test in question and click Go to Results.
For information about the different possible test run statuses, see Eggplant Manager Result Status Types.
Recent Log Errors
This section lists the most recent test runs that encountered errors. These test runs are called out separately because they often demand specific attention.

Note that you can sort the table by clicking any of the column headings.
Test Run Instance Average Duration
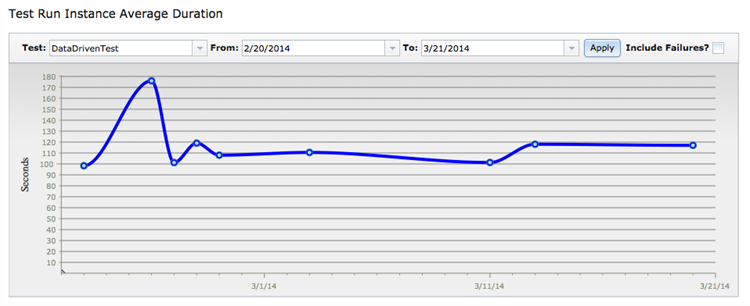
The Test Run Instance Average Duration section generates a graph showing the average duration of an instance of the test over time. Note that this graph measures instances; therefore, if you run multiple instances within a test, you'll get a timing for each instance. However, the numbers plotted are an average of all data for that test.
By default, this graph shows the most recent test that has run. However, you can use the fields at the top of the chart to view whichever test you want as well as change the time frame that the chart displays. Select the Include Failures? checkbox if you want the data to reflect timings for failed tests as well (not selected by default).

When you've selected the options you want, click Apply to see them plotted on the chart.