After running your test, you can view its results in a variety of ways, and from different pages. You can also export results, and you can generate charts showing various information about tests.
You can view test results in the following places in the Eggplant Manager interface:
All of the viewing approaches show a status for the test run. See the Result Status Types page for information on each of the different statuses.
Viewing Results on the Results Main Page
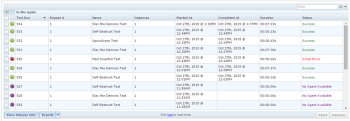
One way to get to test results is to click the Results tab in the top menu bar of Eggplant Manager. The main Results page shows a table view of all the recent test runs, which includes the number of instances associated with that test run, the start time, completion time, duration, and status.
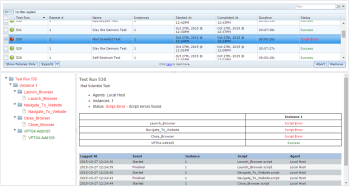
To see the results logs for a specific test run, select the test run in the table view. A list of script instances that were part of that run displays in the lower part of the page:
The detail section on the lower part of the screen consists of two parts:
- The browser: The components of the test run are contained in the browser structure on the left. They are divided by instance if you ran multiple instances for the test run, and then by individual scripts within each instance.
- The detail pane: On the right, the detail pane provides further information about what you select in the browser.
You can select a specific instance of a script in the browser to view the results for that script run in the test.
All images referenced by the script can be accessed through Eggplant Manager, including any error screenshots taken by Eggplant Functional if a script fails. Click the link in the Images column in the detail pane to load the image.
Gherkin Test Results
If you are running Gherkin Feature tests through Eggplant Manager, you can view results here as well. If you select the instance level in the browser tree for a Gherkin test, the detail pane displays the individual SenseTalk handler steps that were run, just as for any other SenseTalk script.
You can also view the Gherkin steps themselves by clicking the execution node, which is the folder above the instance. With the execution node selected, the detail pane displays the full Gherkin Feature with all its steps as it would appear in Eggplant Functional. The individual lines are color-coded to indicate whether the step passed (green), failed (red), or if no handler for the step was found (orange).
For more information about Gherkin tests, see Using Gherkin in Eggplant Functional for Behavior-Driven Development.
File Location
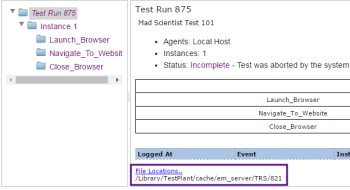
When you select the test run node in the browser, a link to Test Locations appears at the bottom of the detail pane. Click this link to show the location on your file system where the results for the specific test can be found.
This feature can be useful particularly for tests that did not complete, and therefore do not show script results within Eggplant Manager. You might find additional information by reviewing the logs stored on the file system.
Filtering Results on the Table View
You can apply filters to the table view of test results to control which test runs are displayed.
There are multiple ways to create a filter. You can enter a term in the field in the top right corner of the table view. The filter is created and applied to the table as you type, and matches your text with any field in the results. To remove a filter created with this method, click the X at the right side of the field to delete the text from the field.
For more complicated filters, which can include using multiple filter terms as well as choosing data from only specific columns, you can build filters by using the Filter panel. You can open the Filter panel in either of two ways:
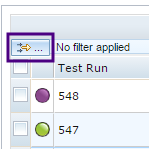
- Use the filter button in the top left corner of the table view of recent test runs.
- Click the down arrow on the right side of the filter field at the upper right corner of the table view, then select Build Filter.
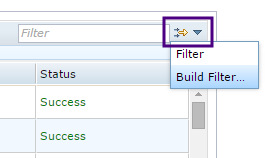
When you open the Filter panel, Create new filter is selected in the Filter field. If you have previously created and saved filters, you can select them in this drop-down list to load the saved rules, then click the Filter button to apply the filter. To create a new filter, follow the instructions below.
Step by Step: Create a Filter
The following step-by-step guide shows you how to create a filter after you've opened the Filter panel:
- Enter a name for the filter in the Name field. (Optional; however, you will need to include a unique name if you plan to save the filter, step 8 below.)
- Select your Match criteria from the drop-down list. This setting determines how rules interact with one another if you add more than one. Your options are:
- all rules: The filter applies only if all rules you create apply to the target test run; that is, every condition you set must evaluate as true on a particular test run result for it to appear in the filtered data.
- any rule: The filter applies if any rule applies to the target test run; that is, if a test run is matched by even one rule in the filter, it appears in the filtered data.
- Click the green plus (+) in the lower left of the panel to add a rule.Note: The first rule, Rule 1, might be present when you open the Filter panel, in which case you would use it to define your first rule.
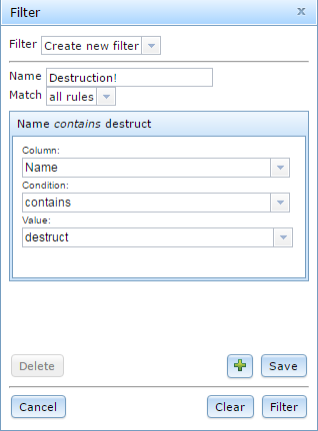
- Within the Rule section, choose the Column you want the filter value to apply to. Select Any Column to have every column checked (except the Started At and Completed At columns; see note below), or select a specific column from the drop-down list to apply the filter only on that column.Note: The values in Started At and Completed At are stored as date values rather than strings; to filter against these columns, you need to select them specifically.
- Select the Condition from the drop-down list. This setting determines how matches are made. Typically, your choices will be:
- contains: Filter to show only test runs that contain the specified value.
- equal: Filter to show only test runs that match exactly the specified value. The match is case-sensitive.
- starts with: Filter to show only test runs that start with the specified value.
- ends with: Filter to show only test runs that end with the specified value.
- does not equal: Filter to show only test runs that do not equal the specified value.
- does not contain: Filter to show only test runs that do not contain the specified value.
- does not start with: Filter to show only test runs that do not start with the specified value.
- does not end with: Filter to show only test runs that do not end with the value specified below.
- is empty: Filter to show only test runs that have no value in the column specified above.
However, if you choose Started At or Completed At as the Column, the options on the drop-down list change to evaluate against date values:
- equal: Filter to show only test runs that match exactly the indicated date value.
- before: Filter to show only test runs that come before the indicated date value.
- after: Filter to show only test runs that come after the indicated date value.
- range: Filter to show only test runs that fall within a range of date values.
- is empty: Filter to show only test runs that have no value in the specified column.
- In the Value field, enter the text you want to filter on.
- To add additional rules, repeat steps 3 through 6.
As you add rules, previous rules collapse to show only their title bars, which displays the rule definition. To return to a previous rule, click the title bar. To remove a rule, click the red X (delete) on the right side of the rule's title bar.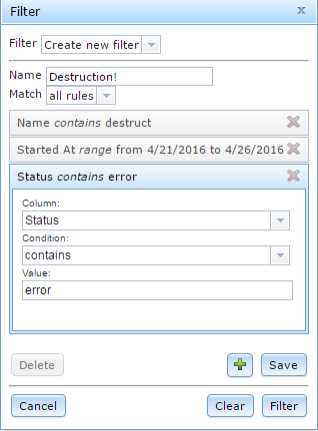 Note: When you use multiple rules, it is important to set the appropriate Match option (step 2) to get the results you're expecting.
 - (Optional) Click Save to store this filter for later use. Saved filters appear in the Filter drop-down list at the top of the panel with the name you entered in the Name field.
- Click Filter to close the Filter panel and apply the filter definition to the table view of test run results.
You can reopen the Filter panel while a filter is applied to edit the filter. You can add new rules, delete existing rules, or edit rules. You can remove an applied filter by clicking Clear filter at the top of the table view.
Similarly, you can edit a saved filter by opening the Filter panel, then selecting the saved filter in the Filter drop-down list. The saved rules load in the panel. You can edit, add, or delete rules. Click Save to save any changes. To remove a saved filter, select it in the Filter drop-down list, then click Delete.
Filtering on Failures
Much of the time, you might want to view results only for test runs that failed. You can use the Show Failures Only button at the bottom of the table view to quickly filter the list to only the failed test runs.
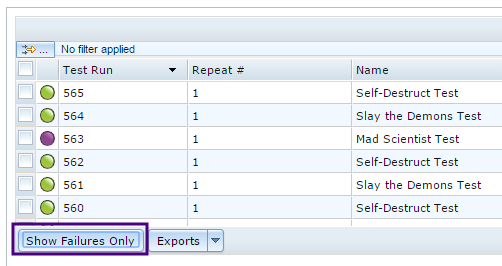
The filter applied with this button narrows the list to any test runs with a status of Script Error; that is, the test ran, but an error occurred in at least one of the scripts in the test.
Eggplant Manager reports other types of errors, such as SUT Allocation Error or Resource Allocation Error, which are not displayed with the Show Failures Only button. In these cases, the test does not run. However, you might want to know about such errors. To filter for such failures, create a custom filter as described above in Step by Step: Create a Filter.
Viewing Results on a Test Page
The results for specific runs of a test are accessible directly from that test page. To view the results of a test run from the test page, select the desired run in the Runs section, and click Go to Results.
View results of an Eggplant Manager test by selecting a test run in the Runs section on the test page
This button takes you to the Results page of Eggplant Manager, with the results filtered to show only that specific test run.
When you have the filtered view on the Results page, you can view and interact with results as you would if you had accessed the test run directly through the Results page.
Viewing Results on the Eggplant Manager Dashboard
Test results can also be viewed on the Eggplant Manager dashboard. The dashboard displays graphs that show the success and failure rate of a specific tests over time, or the execution time of a test over time. For more information about what you can find here, see Using the Eggplant Manager Dashboard.
