Advanced Reporting with Insights
Eggplant DAI Insights help with collecting data from your model runs to make it easier to analyze and access. Reporting in Insights takes advantage of information from the Coverage Report and pulls additional information to help you evaluate your release readiness.
To access Eggplant DAI Insights, from the left side of the Eggplant DAI screen, click Insights.
The Insights page is broken down into the following reports:
- Coverage: Helps you determine how much more testing is needed to reach 90% coverage.
- Bug Hunting: Shows during which action the test failed.
- Test Cases: Provides a summary of test cases.
- Quality Predictors: Provide rich insights into the quality of a software product release using the following two predictors:
- Bug Content: Shows the number of bugs that haven't been found in the product.
- Dev Quality: Helps isolate the features of the development pipeline that correlate with failures in the build system.
Coverage
The main chart in the Coverage tab shows the coverage percentage against the number of runs for the default coverage models (All Nodes, All Pairs, Extended, and Full Exploratory) as well as the custom coverage models that are available in the Coverage Report tab in Modeler. Real data is shown in bold, with points highlighted. The lighter extension of this line indicates the predicted evolution of the coverage.

The information below shows data for the latest version of the selected model:
History
Runs: The number of completed test runs for the selected version of the current model.
Testing time: The total duration of all test runs.
Outcomes
Pass: The number of passed test runs.
Fail: The number of failed test runs.
Pass rate: The percentage of test runs that have passed.
Prediction
Remaining time to 90% coverage: This is an estimate of how long it will take to reach 90% coverage for each coverage model, based on the actual results plotted in the graph. If 90% coverage has been achieved, this field says Done; otherwise, the number of hours remaining until 90% coverage is listed for each coverage type.
Bug Hunting
Click the Bug Hunting tab to load the Bug Hunting report in Insights. This report shows where failures happened in a model without opening test log files.

The Bug Hunting report in Actions context.

The Bug Hunting report in Tags context.
The text chart on the left side of the Bug Hunting screen shows how many discrete actions have failed. In the examples shown above, 22 failures occurred across two actions.
The bar chart on the right side of the Bug Hunting screen shows either Actions or Tags. In the Actions context, the chart shows the successes and failures for each action with at least one reported failure. In the Tags context, the chart shows the number of successes and failures associated with tags that are defined for your model.
Test Cases
The Test Cases report provides an at-a-glance status report for your defined test cases. Click the Test Cases tab in Insights to open this report.

The numbers directly below the Test Cases heading show how many test cases passed out of the total number of test cases. The Results text on the left shows how many times a defined test case path is selected during model execution.
The bar chart on the right side of the screen shows how many of your test cases passed, and how many haven't been tested yet. The vertical axis of the chart shows test case runs by tags defined in the Test Case Builder. The horizontal axis of the chart shows the number of test cases that ran.
Quality Predictors
The Bug Content and Dev Quality predictors in Eggplant DAI Insights let you aggregate and analyze data from various sources across development pipelines such as, Source Control Management (SCM) systems (Git), build system (Jenkins), and requirements software (JIRA, Redmine). These predictors are designed to assess the quality of a software product and the development process by rating scores based on specific criteria specified below.
Bug Content
The Bug Content predictor lets you estimate the number of bugs that are yet to be found in the product. It rates a high score for finding fewer bugs in a software product or website.
The following example shows the number of undiscovered defects on the left and a trend chart of the predicted score on the right.
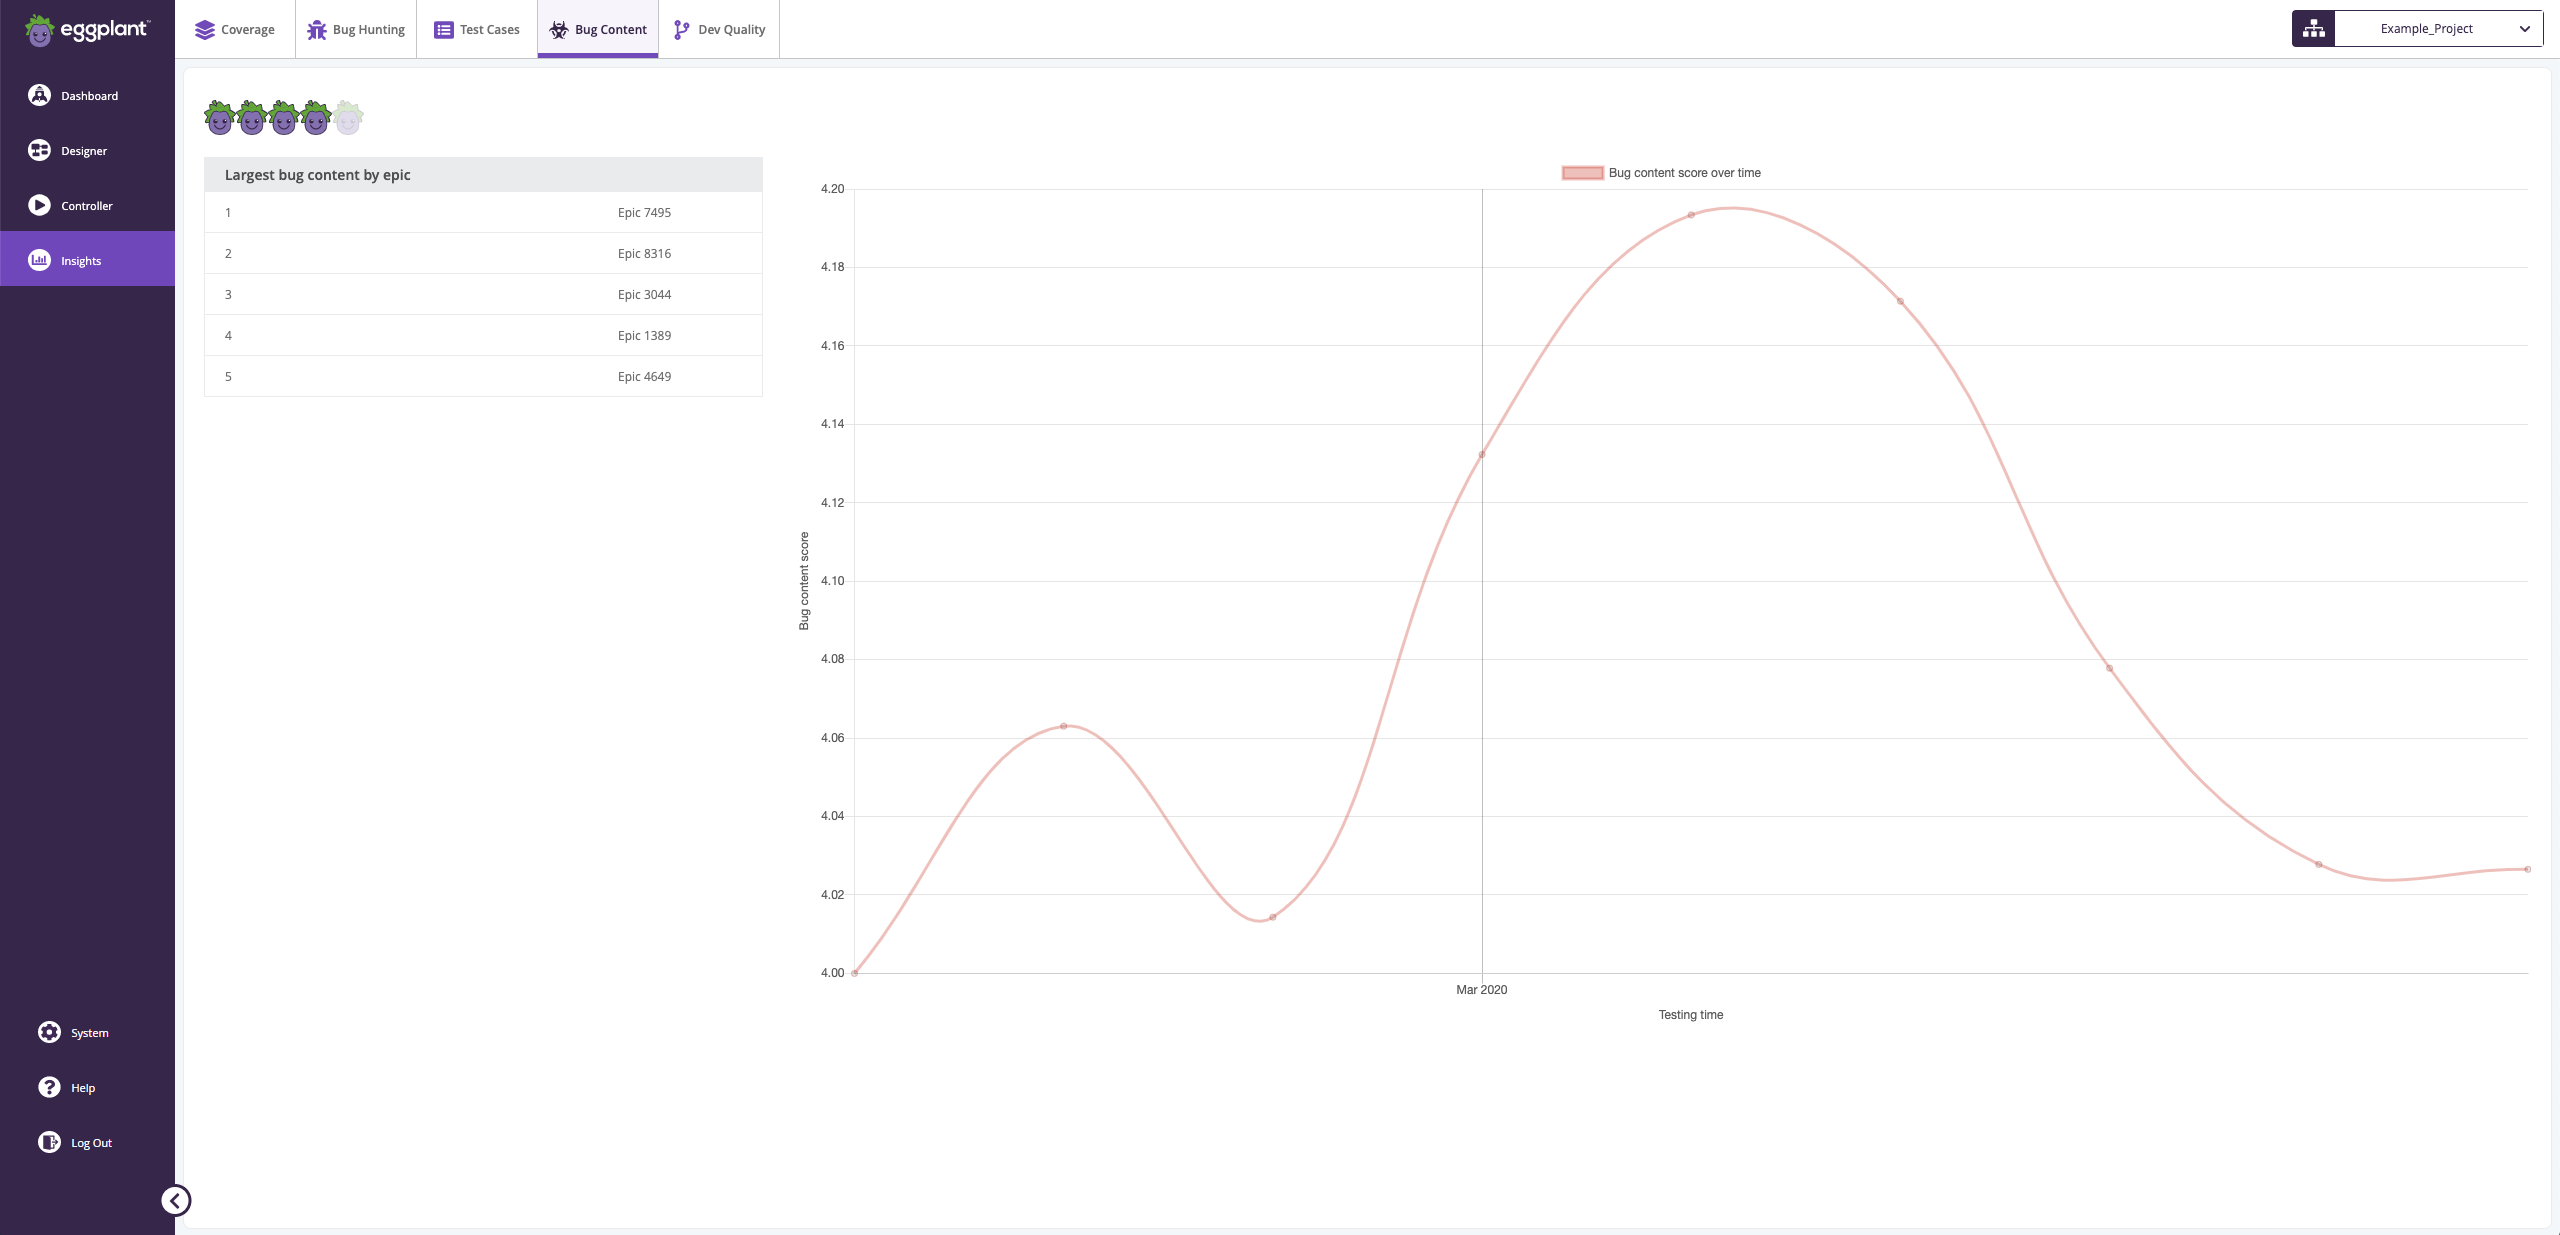
Summarizes the overall quality prediction for your models using quality ratings -- largest bug content by epic.
Dev Quality
The Dev Quality predictor lets you assess the quality of the whole development process and identify the key risks that impact quality providing a better understanding of the quality of your software prior to release. That is, the higher the risk environment in a general build process, the higher the score that is given. Examples of large risk factors are: small or large check-ins or use of specific languages present within the current release and assess their impact.
The following example shows the highest risk factors on the left and a trend chart of the predicted quality over time on the right.
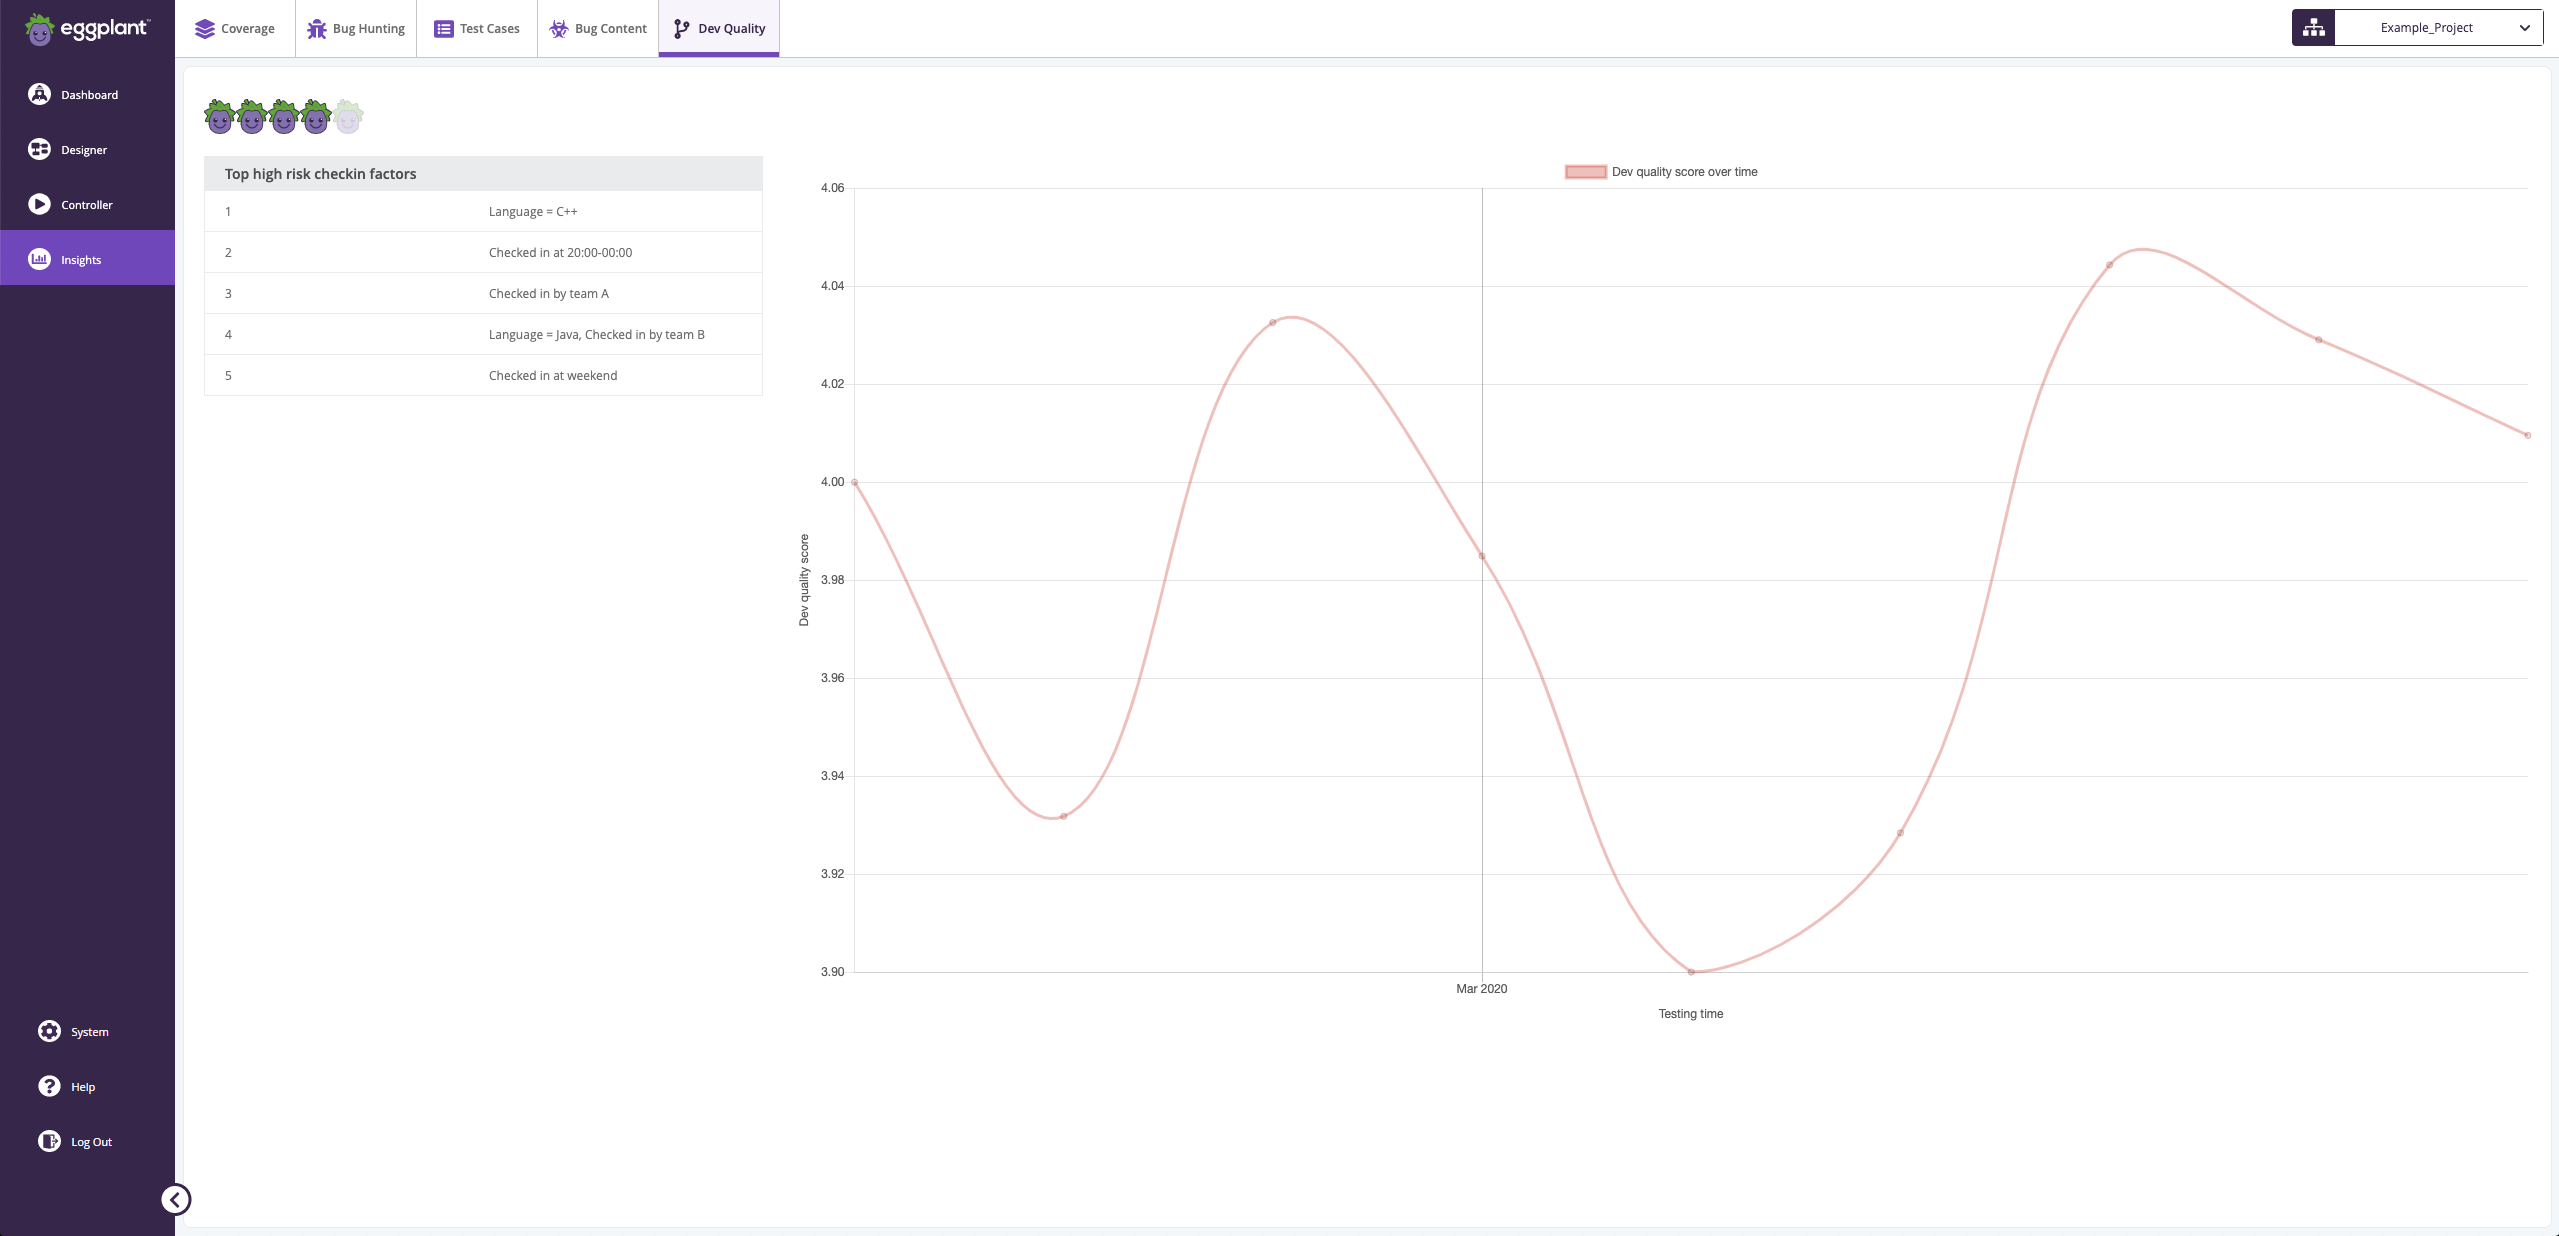
Summarizes the overall quality prediction for your models using top five risks factors
![]() Eggplantsoftware.com | Documentation Home | User Forums | Support | Copyright © 2022 Eggplant
Eggplantsoftware.com | Documentation Home | User Forums | Support | Copyright © 2022 Eggplant