Introduction to Monitoring
When running a performance test, the most common measurements that are recorded and analyzed are transaction times, which is the time taken to complete actions as seen from a user's perspective. However, it is also useful to collect measurements from the system under test (SUT), such as CPU or memory usage, or network traffic statistics. Eggplant Performance makes it easy to monitor the SUT remotely, without needing to install any additional software.
Key Concepts
Following are explanations of the key concepts you need to know about monitoring:
Monitoring Target
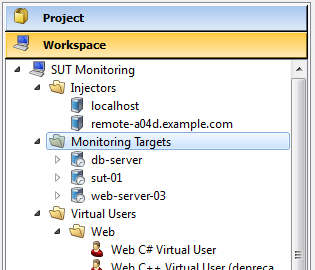
In Eggplant Performance Studio, a monitoring target represents a SUT. It can be given a name that helps to identify it, and the host name or IP address by which it can be reached over the network. The operating system of the monitoring target must also be specified, so that Studio knows which measurement templates are applicable.

Measurement Template
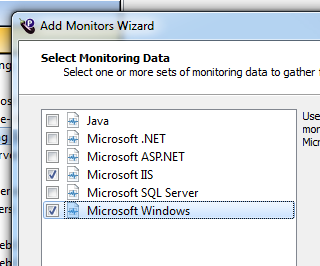
A measurement template is a list of measurements which are suitable for monitoring a particular type of system. For example, the Microsoft IIS measurement template contains measurements such as \Web Service(_Total)\Bytes Received/sec and \Web Service Cache\File Cache Hits %. The Java measurement template contains measurements such as \java.lang:type=Memory\HeapMemoryUsage(used) and \java.lang:type=ClassLoading\TotalLoadedClassCount

Measurement templates are only visible as a list of choices in the Add Monitors Wizard, they cannot be edited. However these are only a starting point, extra measurements can always be added to any monitoring profile, as described in Adding extra measurements.
Measurement
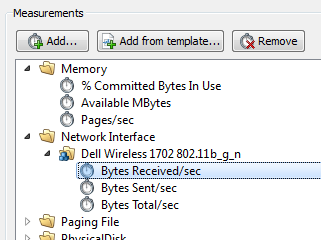
A single measurement is represented by a name, such as \Network Interface(Dell Wireless 1702 802.11b_g_n)\Bytes Received/sec. During a test, Eggplant Performance will repeatedly query the monitoring target for each measurement, and will get back a numeric value and a timestamp. A chart of how each measurement changes during the course of the test can be viewed in real-time in Eggplant Performance Test Controller and after the test in Eggplant Performance Analyzer.

To make measurements easier to understand, the name can be split into three parts:
Category: A way of grouping related counters (e.g.
Network Interface)Instance: A way to specify a device or program when there are many options (e.g.
Dell Wireless 1702 802.11b_g_n)Counter: What is actually being measured (e.g.
Bytes Received/sec)
Eggplant Performance Studio displays measurements in a tree structure, which can be easily searched by typing a filter.
Monitor Type
To perform the monitoring at run-time, Eggplant Performance uses a number of different technologies to collect the measurements. The key monitor types are as follows:
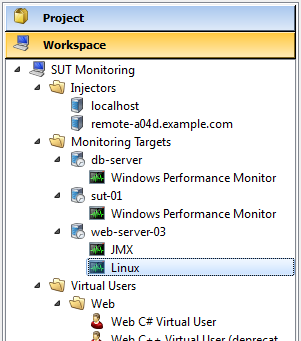
- Windows Performance Monitor
- Linux
- JMX
Each of these require different configuration options, as described in Configuring different monitor types.
Monitoring Profile
In Eggplant Performance Studio, a monitoring profile is a set of measurements to be collected from a specific monitoring target, using a particular monitor type. Any monitoring profiles that have been defined in Studio can be added to a test; the measurements will then be collected from the monitoring target while that test is running in Test Controller. This is described in more detail in Adding monitoring profiles to a test.

Monitor
A monitor is the bit of software that actually collects measurements during a test. A monitor collects measurements as defined in a monitoring profile, and runs on an injector machine. This is shown in the Monitoring architecture diagram.