Getting Started with Eggplant Performance Studio
Eggplant Performance Studio is typically the first part of Eggplant Performance that you interact with. Studio is the tool that you use to create and define load and performance tests.
In the Studio UI, there are sections for:
- Managing your workspaces
- Managing your projects
- Building tests through step-by-step objectives.
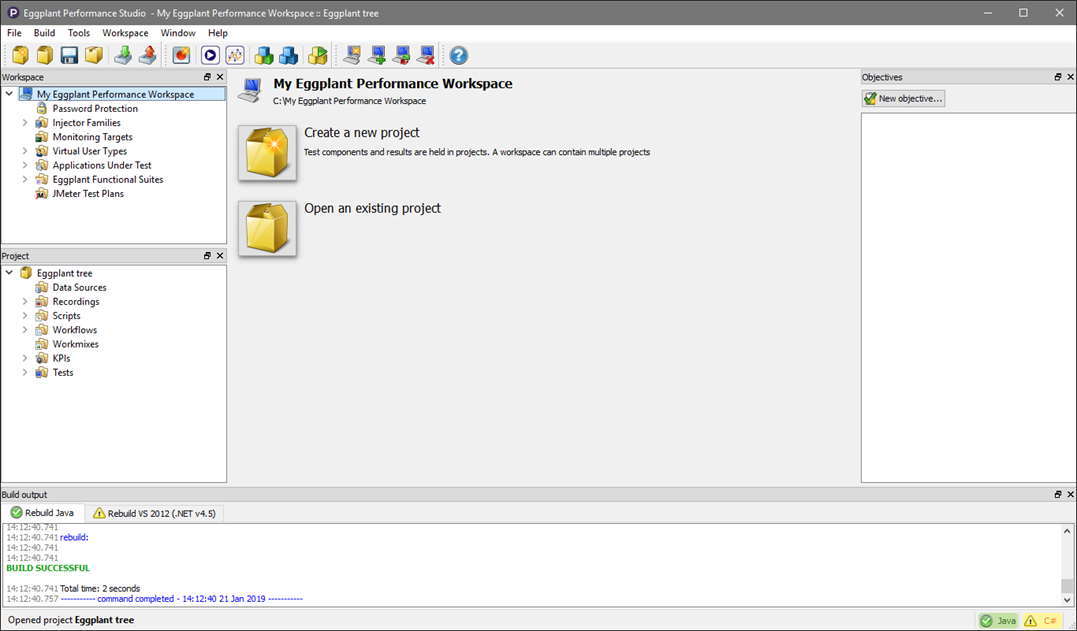 The Eggplant Performance Studio UI with the default panels showing
Studio UI Elements
By default, the Eggplant Performance Studio UI consists of several distinct sections, but you can customize the UI to suit your needs.
-
Control which sections that you want to display: The main Studio menu includes the Window option, where you can toggle each of the optional sections off or on. This menu lets you toggle the Workspace, Project, Objectives, and Build output sections. All the sections are selected by default.
Click an option on the menu to clear the selection and temporarily remove it from the UI. You can also click the delete button on the title bar for the section within the application window to remove it. To return a closed panel to the UI, select it again on the Window menu.
-
Reorganize sections: Drag a section by the title bar into a new location.
-
Open a section in its own window: Click the undock symbol in the upper-right corner of the panel.
Studio Toolbar

The Studio toolbar is divided into three sections:
- Left side: This section includes buttons for managing workspaces and projects.
- Center: This section has the New recording button, which you use to start a recording for a user journey, as well as buttons to launch Eggplant Performance Test Controller and Analyzer and to build your project.
- Right side: The section includes context-sensitive buttons. When you select different items in the Workspace or Project tree, these buttons change to show actions specific to the item you selected. In the toolbar image above, the context-sensitve area is highlighted by the purple box; the buttons displayed in this case let you add, delete, or switch the workspace.
Most options that are available as context-sensitive buttons are also available if you right-click an item in the Workspace or Project tree.
To see what any button does, hover the cursor over it to view the tooltip text.
Use the Help button on the right side of the toolbar to access the Eggplant Performance Studio documentation.
The Viewer Pane
The center section of the Studio UI is known as the Viewer pane. This area is where you work with and update content. Anything you select in the Workspace, Project or Objectives trees will display a View of the selected item(s) in the Viewer pane. This section is always visible, and always appears in the centre of the window.
Workspace
The Workspace panel of the Studio UI is typically found in the upper section of the left sidebar. Remember, you can:
- Click and drag this panel by the title bar to move it into a different location
- Open it as a separate window
- Close the panel.

A workspace contains objects and assets for your tests that you might want to access across multiple projects. To allow this, you can create multiple projects within a single workspace, and they share the same injectors, custom virtual users (VUs), and other elements defined in that workspace. If necessary, you can also create multiple workspaces.
The Workspace tree includes the following sections:
- Injector Families: This section is where you add or define injectors for your tests. For information about injectors, see Managing Injectors.
- Monitoring Targets: A monitoring target is a definition of which systems to monitor. Use this section to define and edit monitoring targets. For information about monitoring targets, see Introduction to Monitoring.
- Virtual User Types: This section is where you find the default virtual user types, and where you can create custom virtual user types. For information about virtual users (VUs) and virtual user types, see Virtual Users.
- Application Under Test: This section is where you define and manage applications that you want to test, known as applications under test (AUTs). For complete information about AUTs, see Managing Applications Under Test.
- Eggplant Functional Suites: This section is where you connect to Eggplant Functional suites for GUI-level testing. For information about using eggPlant Functional suites with your performance tests, see Managing Eggplant Functional Suites in Eggplant Performance.
For more information about working with workspaces, see Managing Workspaces.
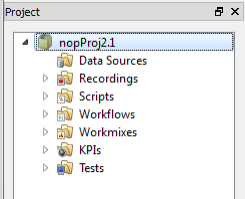
Project
The Project panel of the Studio UI is typically found in the lower section of the left sidebar. Remember, you can:
- Click and drag this panel by the title bar to move it into a different location
- Open it as a separate window
- Close the panel.
You typically use a project to maintain assets related to a specific test or series of tests for a specific application under test (AUT). Elements found within a project include:
- Recordings
- Scripts
- Workflows
- Data sources.
The project also has access to all the assets defined for the workspace, which are available for creating and running tests. A project can belong to only one workspace.
The Project tree includes the following sections:
- Data Sources: Data sources are files that include data that is required by running scripts. This section is where you connect your external data sources so that the scripts are able to access them during test runs. For information about the types of data sources and how to create them, see Using Data Sources in Eggplant Performance.
- Recordings: If you record your user journeys through Eggplant Performance, the recordings are stored in this section. For information about recordings, see Working with Recordings.
- Scripts: This section is where you find the scripts that belong to the project. For information about your scripting options with Eggplant Performance, see Working with Virtual User Scripts.
- Workflows: You can organize the steps of your tests into workflows. This section is where you create new and modify existing workflows. For information about using workflows, see Working with Workflows.
- Workmixes: A test can include multiple workflows or scripts. A workmix lets you set the weight for each element in the test. For information about workmixes, see Using Workmixes.
- KPIs: You can define key performance indicators (KPIs) against which you gauge your tests' performance. Use this section to create KPI collections and manage existing collections. For information about KPIs, see KPIs in Eggplant Performance.
- Tests: This section is where you define tests and edit existing tests, including setting Virtual User Group options, attaching data sources, and choosing monitoring targets. For information about test creation, see Managing Tests.
For more information about working with projects, see Managing Projects.
Objectives
By default, the Objectives panel is found in the right sidebar of the Studio UI. As with other panels, you can:
- Click and drag this panel by the title bar to move it into a different location
- Open it as a separate window
- Close the panel.
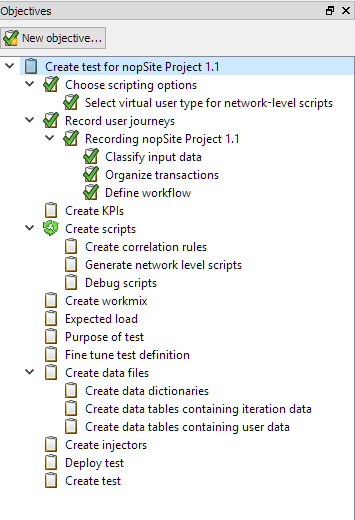
Objectives provide a guided method for test creation. If you have no objectives in progress, the column under Objectives is empty.
To create an objective, click New objective. You can then work through the steps in the tree to create the assets and data for the performance test you want to run. When you select a step in the tree, the Viewer pane in the center of the Studio UI provides detailed information about what is required to complete the step as well as the controls or links to do so, when appropriate.
As you complete steps, you see a green check mark in the tree to show your progress. For more information about using the Objectives feature, see Creating an Eggplant Performance Test from Objectives.
Build Output
By default, the Build output panel is found along the bottom of the Studio UI. As with other panels, you can:
- Click and drag this panel by the title bar to move it into a different location
- Open it as a separate window
- Close the panel.
When you build the project, this section shows the progress of the build, including any errors and warnings. In the project, there is a tab for each virtual user type, although all types are built at the same time. This section is empty if you haven't build the project, or haven't built since you launched the application.
For more information about building your project, see Building Your Project.
Resetting the Window Layout
After moving panels around, you may want to reset the Studio window layout to its default state, how it appeared when run for the first time.
- Select Window > Reset window layout.
- When asked if you want to reset the application to its default layout, click Yes.
These steps set the toolbar back to its default appearance. They also dock the Workspace, Project, Objectives, and Build output sections back to their default state and location.