Getting Started with Eggplant Performance and JMeter
Eggplant’s load and performance testing solution, Eggplant Performance, can be used to run JMeter test plans. Eggplant Performance adds strong test composition, environment management, dynamic control, and result analytics to JMeter’s existing capabilities.
This guide covers the following topics:
- Quick Start: If you're familiar with JMeter and software performance testing, jump in to this section, which features step-by-step instructions for importing your JMeter test plans, running them in Eggplant Performance Test Controller, and viewing results in Eggplant Performance Analyzer.
- Terminology and Functionality Comparison: No two tools use the same terminology, and how you use the tools can differ vastly even when your end goal is the same. This section highlights key conceptual differences between Eggplant Performance and JMeter and provides direct comparisons between common JMeter test elements (samplers, controllers, etc.) and their Eggplant Performance equivalents.
Quick Start
This guide assumes you have already installed Eggplant Performance and JMeter. If you need help with installation, see Installing the Eggplant Performance Applications before proceeding.
To use Eggplant Performance with JMeter, you need a JMeter test plan. You can use your own test plan or download the sample test plan used in this guide.
The nopCommerce test plan consists of 50 virtual users (VUs) repeatedly browsing to http://nopcommerce.testplant.com, logging in, then logging back out. The intial ramp-up is set to 2 minutes, and the workflow is repeated for 50 iterations per VU.
Creating a New Workspace
After Eggplant Performance has been installed, launch Eggplant Performance Studio. Studio prompts you to create a new workspace, locate an existing one, or import a previously exported workspace:

Select Create New, then use the Create a workspace dialog box to give the workspace a name and browse to a directory:

A folder for the workspace is created in the directory you specify.
Your newly created workspace is opened in Studio, revealing a collection of six folders. You can think of these as somewhat similar to JMeter's test elements, in that each folder offers some functionality that you'll likely want to use at some point.
The folder of interest is of course the JMeter Test Plans folder. Before you can make use of it, you need to create a project.
Creating a New Project
A project in Eggplant Performance is typically where you maintain assets related to a specific test or series of tests for a specific application under test. Every test in Eggplant Performance is run from within a specific project.
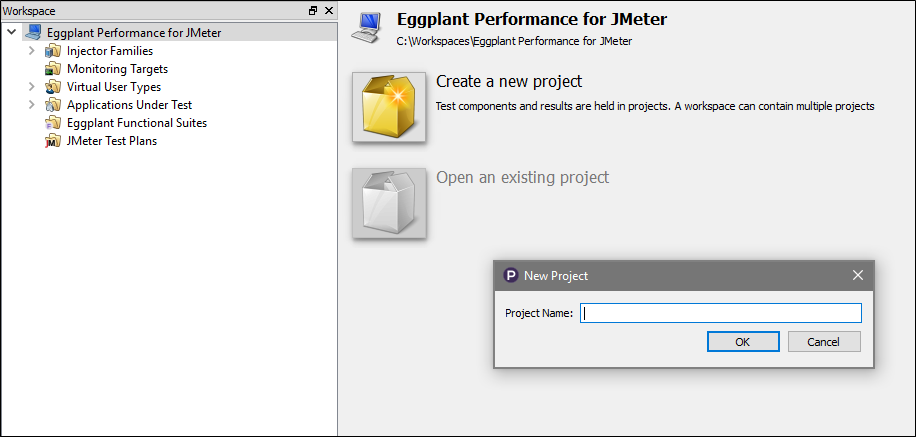
To create a new project, click Create a new project in the central pane of the Studio UI, then give the project a suitable name:
Importing the JMeter Test Plan
After you create a project, you can import your JMeter test plan. Right-click the JMeter Test Plans folder in the workspace, then select Import JMeter test plan.
A dialog box appears to indicate that the test plan .jmx file has been copied into the workspace.
Eggplant Performance will not modify the original .jmx file. If you want to update the test plan without repeating the import process, you can open and edit the .jmx file that was copied into the workspace.
You and locate imported test plans on disk in the workspace folder. Go to Tools > Explore > Workspace files on Studio's main menu, then locate the JMeter folder. Alternatively, you can right-click the test plan in the workspace, then select Open test plan in JMeter.
Creating a Test
Next, you need to create a test for the test plan. The test is a key component of Eggplant Performance The test definition is what Test Controller needs in order to execute anything.
The main purpose of the test in the context of JMeter is to let you distribute the load generation across one or more injectors. It also lets you define KPIs and enable server monitoring.
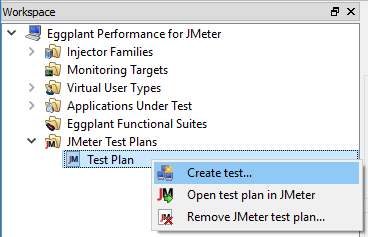
To create a test, right-click the test plan node, then select Create test.
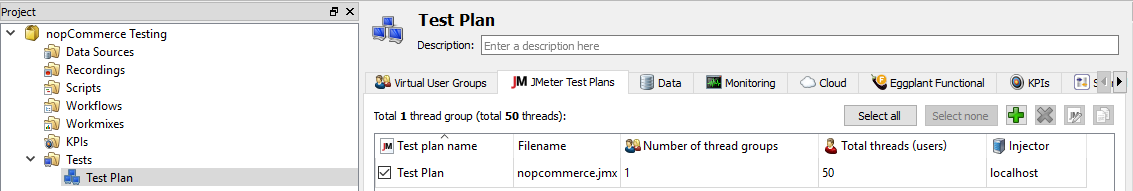
The new test appears in the project under the Tests node. Selecting it reveals details about the test in the center pane of the UI:
Running the Test
At this point, you're all set to run your test in Test Controller. To start the test, right-click the test in Studio, then select Open test in Test Controller. This action launches Test Controller and loads the test. If the test was already running, Test Controller reloads the test (in case you've made any changes to it).
Opening the test in Test Controller does not launch the test, however. To start the test, click the green Start test button ![]() on the toolbar to open the Start test run dialog box:
on the toolbar to open the Start test run dialog box:
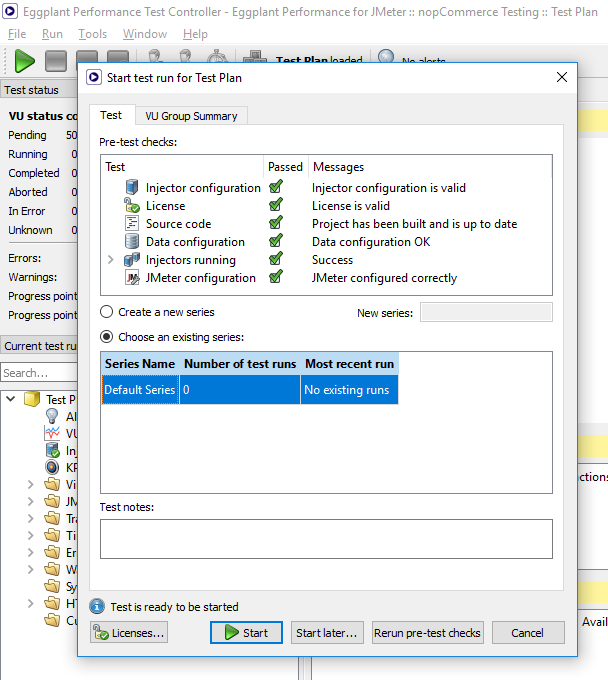
On this dialog box, you see that Test Controller performs several pre-test checks to ensure that all the required assets and configurations are in place for the defined test. If everything is ready, you can click Start at the bottom of the dialog box to start the test.
Customizing the Dashboard
Assuming the test started successfully, Test Controller soon updates its runtime dashboards with information being collected by the VUs. The default view typically consists of the following tables and charts:
- VU concurrency chart
- Transactions Summary
- Injector status (useful for keeping an eye on hardware utilization)
- HTTP response code rate
There are, however, many additional interesting charts to display, available in the tree view on the left-hand side of the UI. For more information about the available charts and reports, see Real-Time Test Monitoring in Test Controller.
Launching Analyzer and Analyzing a Test Run
Test Controller displays charts and tables of data. However, Analyzer is the Eggplant Performance component that is best suited for digging deep into collected test results. Analyzer is installed separately by default, so make sure you download and install it before proceeding.
After you install Analyzer, you can launch it either from its desktop shortcut or by using the toolbar button in Studio:
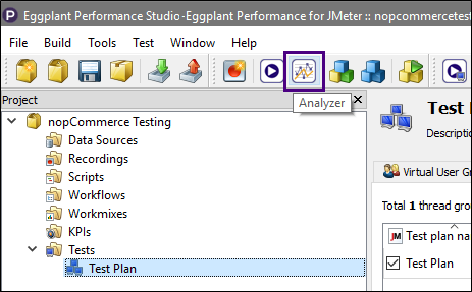
After you launch Analyzer, click the Analyze a test run button in the center pane to open the Test Run Browser dialog box. You'll be presented with your workspace, including any completed test runs:
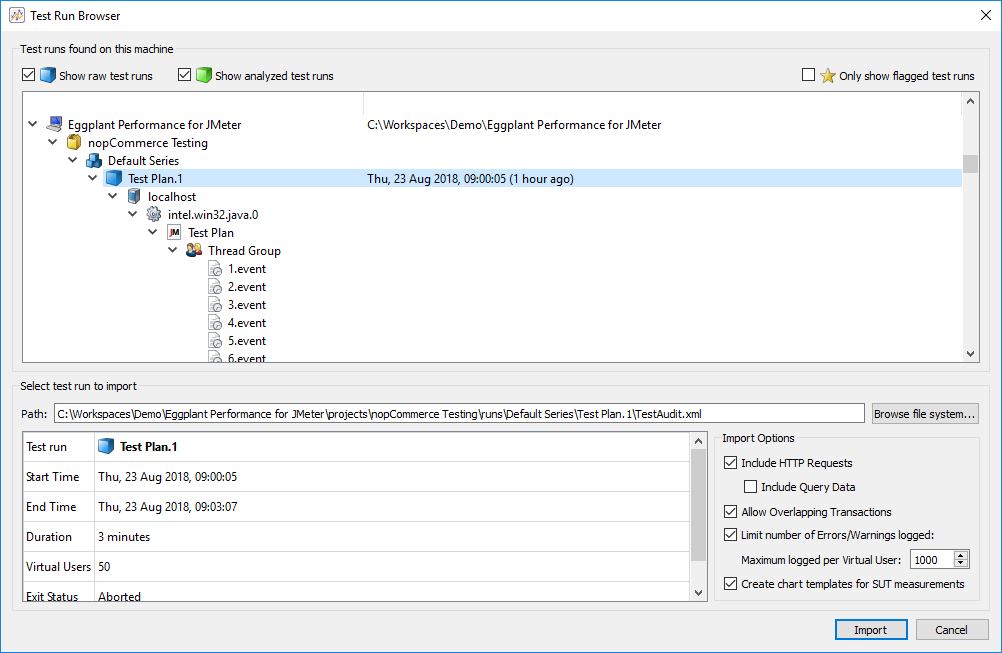
Select the test run you want to analyze, then click Import.
After the import process completes, you should see several folders appear in the left-hand pane with your test run at the top. When you select the test run, the right-hand pane displays several tabs with detailed information about the test that was executed, such as when it was started and stopped, the VU Group composition, which injectors were used, errors and warnings encountered, and so forth.
Creating an Analysis View
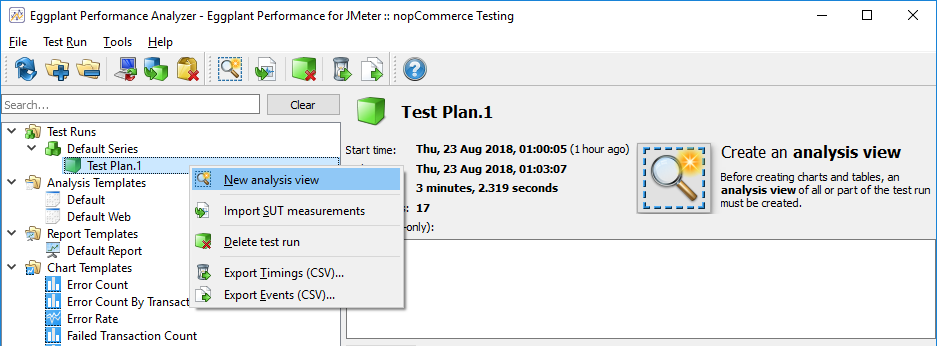
The last step involves creating an analysis view, which is a collection of charts and tabular data that are generated based on a specific analysis template. To create an analysis view, right-click the test run in the left-hand tree view, then select New analysis view to launch the Create an Analysis View wizard.
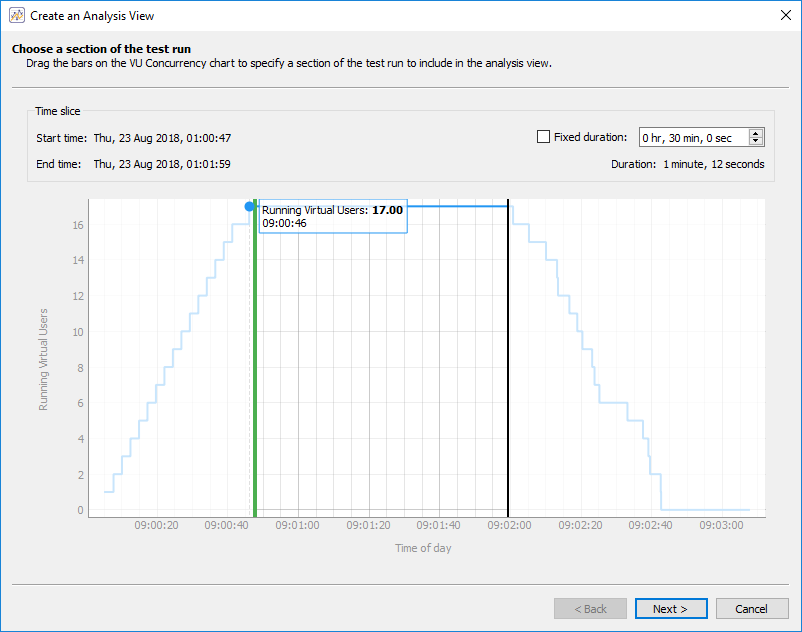
The analysis view lets you focus your analysis on a particular period of time within the test. For example, you might be interested in only response time statistics when the test was at "steady state," which would exclude the ramp-up and ramp-down periods. To change the focus period, which is called the time slice, drag the vertical sliders to the desired position.
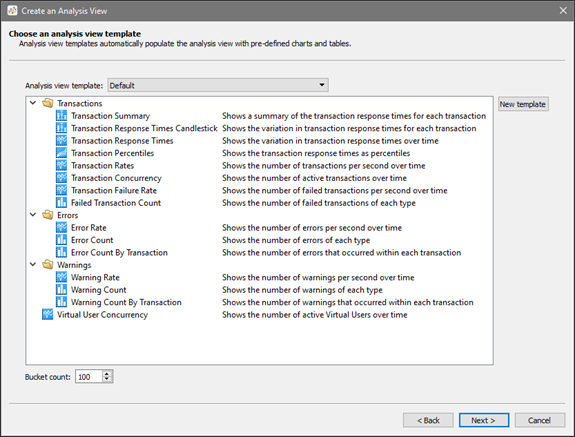
Click Next, then the wizard presents a screen where you select which analysis view template to use. There are two built-in templates: Default and Default Web. Select the Default Web template to generate HTTP request-level information in addition to what is generated by the Default template.
Click Next and the wizard switches to the Apply Grouping screen. This page is most useful for grouping error messages together that would otherwise be logged separately, such as when the error messages contain dynamic values. For more information, see Using Grouping in Eggplant Performance Analyzer.
For now, you can click Next, which leads to the final step of the wizard. Give the analysis view a name, then click Finish to complete the analysis view creation.
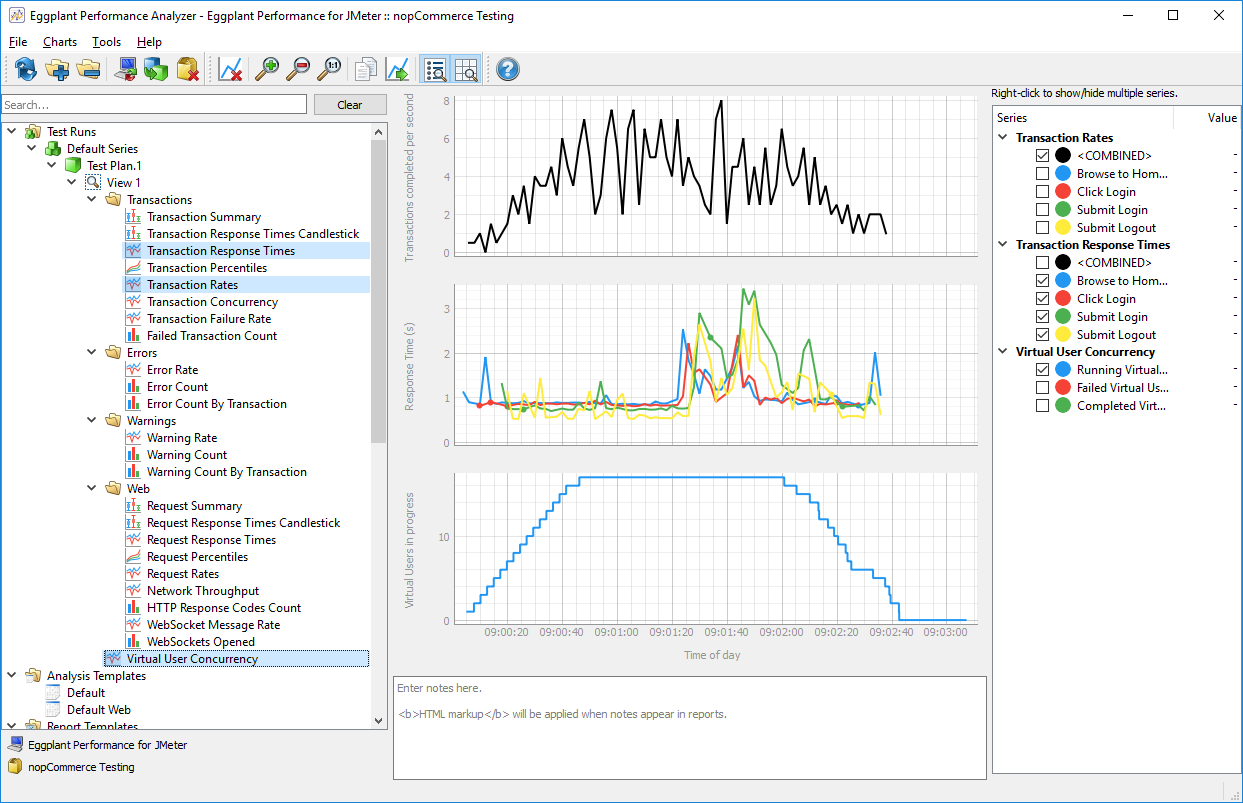
Viewing Analyzed Results
You've now generated charts and tabular data from your JMeter test. You can explore the different charts by selecting them in the tree. It is often useful to view two or more charts at the same time on the same X-axis. To do so, hold down Ctrl and select multiple nodes as depicted in the following screenshot:
Next Steps
Now that you're familiar with the end-to-end process of importing a JMeter test plan, running a test, and analyzing its results, you might want to explore the other functionality available in Eggplant Performance. Here are some useful links to get you started:
- Server Monitoring: Gathering client-side metrics gives you only half the picture. Make sure to define monitoring targets so that you can see the hardware utilization your VUs incur on the system you're testing.
- Web Log Viewer: The Web Log is a useful debugging utility that exposes the lower-level HTTP request and response data. By default, only 1 in 100 VUs has a web log enabled, but you can modify this number in the test's Runtime Settings. The first VU in your test should feature a globe icon
 that can be used to open the web log. See Eggplant Performance Test Controller Viewers for information about how to open the web log directly from a VU that has logging enabled.
Terminology and Functionality Comparison
Eggplant Performance frequently uses different terms for concepts you might be familiar with from JMeter tests. Use the following tables to familiarize yourself with how common JMeter concepts are referenced in Eggplant Performance.
High-Level Concepts
| JMeter | Eggplant Performance |
|---|---|
| Thread | Known as a Virtual User (VU) in Eggplant Performance. A VU can however make use of multiple operating system threads |
| Recording | Core functionality for Web VUs. There is also recording functionality for the Citrix VU. |
| Sampler | Samplers in JMeter represent the protocols and technologies it supports. They roughly correspond to Virtual User Types in Eggplant Performance. Many of the different protocols in JMeter are inherently supported by Eggplant Performance as a result of the latter's ability to leverage arbitrary DLLs (C#) and JARs (Java) containing client implementations, for example an XML-RPC library or an FTP client. |
| Logic Controller | There are in essence two flavors of Logic Controller in JMeter: one concerns itself with flow control (If, ForEach, Loop, etc.) and the other is a necessity as a result of JMeter's architecture (e.g. Recording or Transaction Controllers). Logic Controllers don't exist in Eggplant Performance; flow control is largely defined through the use of built-in functionality such as workflows, or in code where there is unparalleled flexibility. |
| Assertion | Assertions are typically defined using wizard-based generation rules. These generation rules ultimately plant code into scripts and are designed to be reused across different scripts, meaning you spend less time creating them and more time running tests. Eggplant Performance adds assertions by default for common scenarios, such as ensuring HTTP status codes and HTML page titles match expected (recorded) values.
|
| Timer | Timers are known as pauses in Eggplant Performance. Pause statements are automatically planted in scripts generated from recordings. These pauses, typically found between transactions, aim to represent "think time" — that is, the time a real user would wait between a given set of transactions. Pause durations are controlled in Runtime Settings and can also be modified while the test is running. |
| Pre-Processor | There is no direct equivalent to JMeter's Pre-Processors. For the User Parameters Pre-Processor, you would configure and use data sources as with any other test data. The JSR223 Pre-Processor, which essentially allows custom code to be executed ahead of a Sample being sent, is roughly equivalent to using the Custom Code Generation Rule. |
| Post-Processor | Post-Processors in JMeter are primarily used for extracting dynamic values from HTTP responses in order to perform data correlation. Eggplant Performance features a Data Correlation Generation Rule that is able to use left/right boundaries or regular expressions in order to extract values in much the same way as the Boundary and Regular Expression Post-Processors. The data correlation rule can also search for and suggest potential candidates for correlation based on heuristics, making it quick and easy to configure them. Extraction can also be performed against HTTP response headers. |
| Config Element | Config Elements in JMeter cover a wide variety of settings that are usually not found in the same place in Eggplant Performance. Have a look through the individual elements in the Common Elements list below to see what the Eggplant Performance equivalent is and where to find it. |
| Listener | The concept of a Listener does not exist in Eggplant Performance. Instead, whenever you run a test, the default behavior is for all information to be captured and become visible in Test Controller. Therefore, you don't need to tell Eggplant Performance that you want to store results. The only notable exception is the collection of HTTP response data, because collecting all response data can result in information overload and unnecessarily high disk space usage for each test you run. By default, only 1 in every 100 VUs has a web log enabled, and the default policy is to keep only the last 2 iterations worth of HTTP data. You can change the defaults to increase or even further decrease logging. |
Common Elements
| JMeter | Eggplant Performance |
|---|---|
| Test plan | Test |
| Thread group | Virtual User (VU) group |
| User Defined Variables | Global variables |
| HTTP Request Defaults | There are a few different places in Eggplant Performance where default options can be modified. Most of these can be found in the Runtime Settings > Web: Options tab for VU Groups featuring Web VUs. Examples of settings you can changed here include HTTP connect and receive timeouts, number of retry attempts, number of concurrent threads to use for downloading resources ("Parallel downloads"), and selection of the client implementation (i.e., which HTTP library to use). Parameterization of server hostnames and protocol (HTTP/HTTPS) is typically done through definition of global variables because hostnames are already parameterized by default (specifying data overwrites the hostname encountered during the recording). Setting of a proxy server is done either before recording (Authentication tab in the Proxy Recorder wizard) or during the last step of the script generation wizard (Authentication tab). You can also choose whether to retrieve all embedded resources on this last step (Mode tab). |
| HTTP Cookie Manager | Built-in functionality. By default, Eggplant Performance handles cookies automatically at runtime. Each VU maintains its own cookie cache, and the default behavior is for the cookie cache to be empty at the start of the test, assuming the browser's cookie cache was also empty at the time of the recording. |
| HTTP Header Manager | Built-in functionality. HTTP request headers are automatically added to generated script code based on the HTTP headers observed during recording. You can manually customize headers by using the C# and Java APIs. |