Custom Metrics in Test Controller
You can create custom metrics in your scripts that you can use in Eggplant Performance Test Controller and Analyzer to view specific information about your test environment. Custom metrics are created via functions placed within your script code. See the API Reference for C++, Java, and .NET for information about the recordMetric() function.
Custom metrics are collected during runtime and can be charted within Test Controller for live monitoring. To create custom metric charts in Test Controller, follow the steps below.
Step by Step: Creating Custom Metric Charts
-
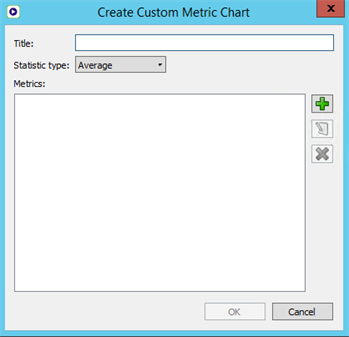
Right-click Custom metrics in the Current test run section of the left sidebar, then select Create custom metric chart to open the Create Custom Metric Chart dialog box.

-
Enter a Title in the field. This text will be the title of the chart you create. You should title it something descriptive to its purpose.
-
For Statistic type, select the type of chart you want to create from the drop-down list. Your choices are:
- Average
- Rate
- Cumulative count
For detailed information about the types of charts, see Understanding Charts and Events in the Eggplant Performance Analyzer section.
-
Click the green plus (+) button to open the Custom metric name dialog box.
-
Enter the name of the custom metric. This name will be the same as the code you entered in your script.
-
Click OK on the Custom metric name dialog box.
-
(Optional) To add additional metrics to the chart, repeat steps 4 through 6.
-
Click OK on the Create Custom Metric Chart dialog box.
The new chart appears under the Custom metrics collection in the left sidebar. You can create additional custom metric charts, and you can use them for live monitoring of test runs in the same way as other metrics. For information about monitoring, see Real-Time Test Monitoring in Test Controller.
User-defined metrics are also available for post-run analysis in Eggplant Performance Analyzer.