Eggplant Performance Test Controller User Interface
The Eggplant Performance Test Controller user interface (UI) is where you run and monitor your performance tests. It lets you:
- Start and stop tests
- View real-time monitoring of the current test run
- Create and view user-defined metrics
- Access previous test run data

UI Elements
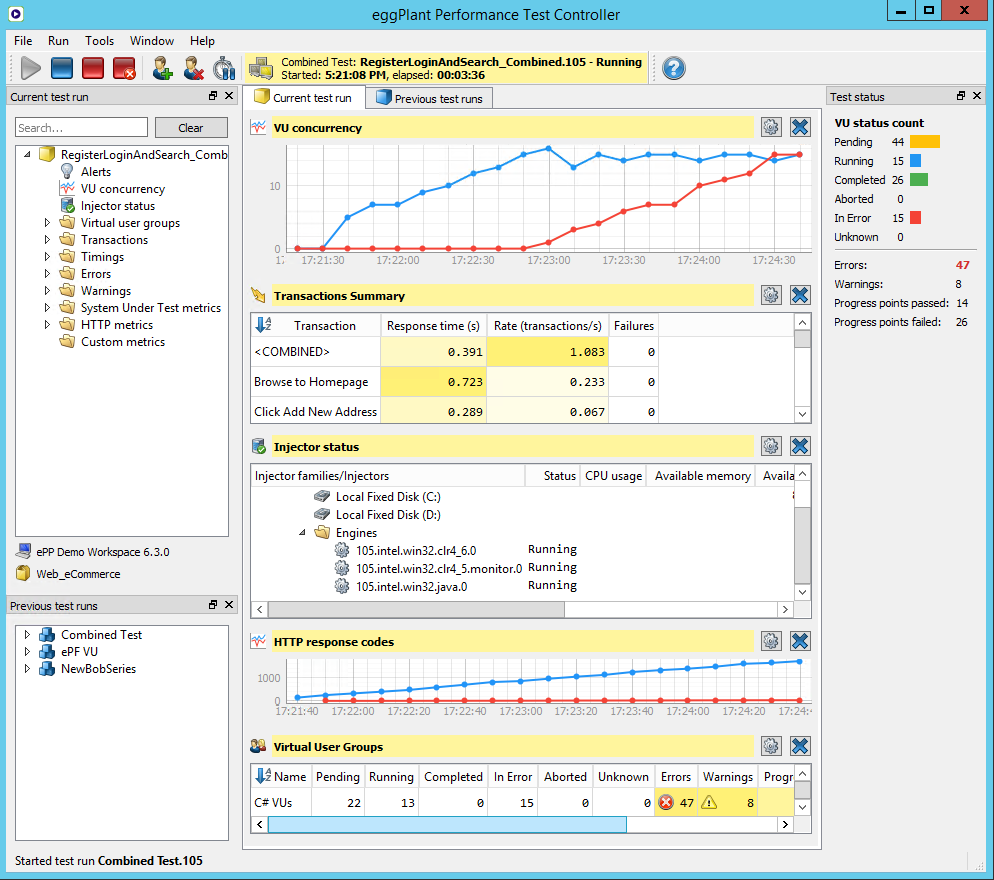
The following section describes the various parts of the Test Controller UI.
Toolbar

The toolbar includes the buttons you use to start a test, stop a running test, or make changes to virtual users (VUs) while a test is running. For a complete description of these toolbar options, see Running Tests in Test Controller.
To the right of the toolbar buttons, you'll see the status area, which provides information about the current test. While a test is running, this section displays the elapsed time for the test.
The Alert section shows if any errors occur during a test run. The alert displays at least part of the text of the alert:
To see the complete alert text, click in the Alert area to add the Alert report to the Current test run tab. If there are multiple alerts, all of them are displayed in the report. (Note that this is the same report view you see if you open Alerts from the Current test run panel on the left sidebar.)
Use the Help button on the right side of the toolbar to access the Test Controller documentation.
Current test run

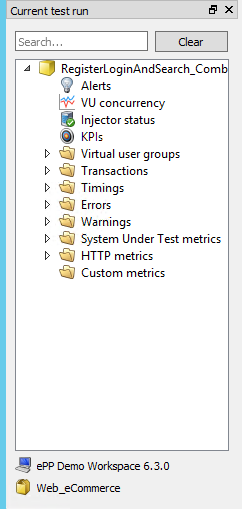
The Current test run panel shows a tree view for the test you currently have open in Test Controller. The nodes under the test represent the metrics for the test, which you can view as tables and charts in the Current test run tab in the center part of the Test Controller window for live monitoring while the test is running.
To open a test metric, navigate to it in the tree for the current test, then double-click it. Optionally, you can right-click your choice, then choose from several options for how you want the table or chart to appear, including opening in a new window.
Note that Custom metrics is found on the bottom of the tree. If you have created custom metrics for a test, they will show under this node. To create custom metrics, right-click the Custom metrics folder, then select Create custom metric chart. For detailed information about custom metrics, see Custom Metrics.
For information about live test monitoring, see Real-Time Test Monitoring in Test Controller.
Previous test runs

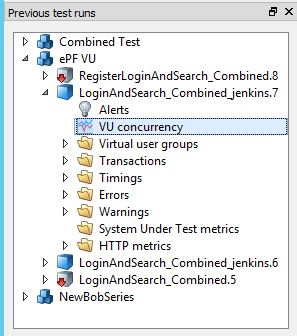
The Previous test runs panel is where you can access monitoring data from any of your previous test runs. Tests are listed by the series in which you ran the test. Navigate in the tree to the test and specific data you want to view, then double-click it. Charts and tables for previous test runs open in the Previous test runs tab in the center part of the Test Controller window.
For complete information about viewing previous test run data, see Previous Test Runs.
Center Pane

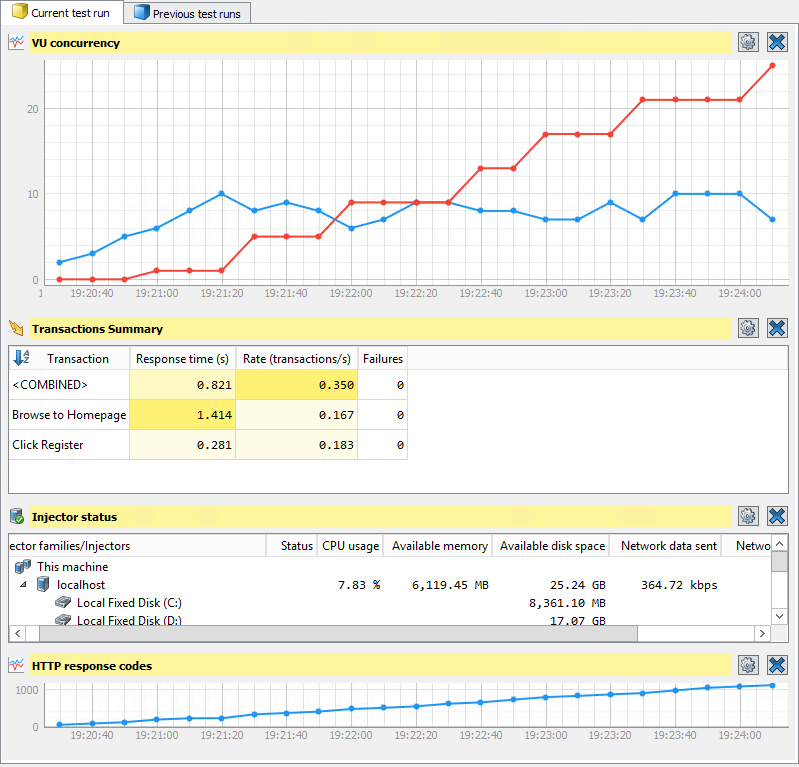
In the center pane of Test Controller, you will find the Current test run tab and the Previous test runs tab. Any metrics you open for the current test open in the Current test run tab, and data for previous tests opens in the Previous test runs tab.
These tabs are fully customizable by the tables and charts you choose. When you open a test for the first time, Test Controller selects metrics that seem most appropriate to the test, but in most cases you will see:
- VU concurrency
- Transaction summary
- Injector status
- HTTP response codes (web tests only)
You can adjust the viewing size of any table or chart by using the slider between metrics and dragging to your preferred size. You can rearrange metrics by dragging from the header into a different location within the window. You can also open any metrics in its own window. For more information about live test monitoring, see Real-Time Test Monitoring in Test Controller.
When you customize the view for a test, Test Controller remembers your choices. When you open the same test again, Test Controller opens the same metrics with the same placement. See Importing and Exporting Window Layout for more information.
Test status
On the right pane, you'll find the Test status panel. This panel provides a snapshot view of the progress of VUs during the test: how many are Pending (not yet started), Running, and Completed. It also show the number of VUs Aborted or In Error (if any). If your test includes progress points, you see those tracked on the bottom of this panel along with Errors and Warnings for the test as a whole.
Exporting Window Layout
If you prefer customizing your window layout in Test Controller, then you might want to save those changes to use it later with other tests. You can do this by exporting the window layout into a JSON file and import it later to apply your saved layout settings.
To export a window layout, click Window > Export a window layout, and save the JSON file.
Importing Window Layout
You can use your preferred window layout settings by importing the JSON file that you exported in the previous section.
To import a window layout, follow these steps:
-
Select Window > Import a window layout.
-
In the Select window layout dialog, select the JSON file that you want to import the window layout from and click Open. A message appears at the lower pane confirming the import of the selected windows layout.
It is important to be aware of the following limitations before using both Import window layout and Export window layout options:
- You cannot import or export window layouts while a test is running.
- You can export the window layout from a particular test, and import it again while another test is open.
- While importing a window layout, any views that are not applicable to the current test will not get imported. A warning message will appear listing the views that could not be imported.
- You cannot export or import views from the Previous test runs tab(s). The exported JSON file only contains information about the layout of the views in the Current test run tab(s).
- Importing a window layout will close all currently open views, including those on the Previous test runs tab(s).
Resetting the Window Layout
You might run into a situation that requires you to set the Test Controller window layout to its default state. Do the following:
-
Select Window > Reset window layout....
-
Click Yes when prompted to reset the application to its default layout.
Completing the above steps sets the toolbar back to its default appearance. It docks the Current test run, Previous test run, and Test status panels back to their default state and location. It also restores the default view associated with the type of test you currently have loaded. After resetting the layout, Test Controller appears as it did right after you installed it and opened it for the first time.
You cannot reset the window layout while a test is running.