Adding Monitoring Profiles to a Test
During a test, Eggplant Performance can run monitors to monitor the system under test. Monitors run on an injector, similar to the virtual users that run during a test to provide load and interact with the system. This is shown in the Monitoring architecture diagram.
For each different test created in Studio, one or more monitoring profiles can be selected for monitors to run during the test.
-
In the Project tree, select a test item. The Test view opens.
-
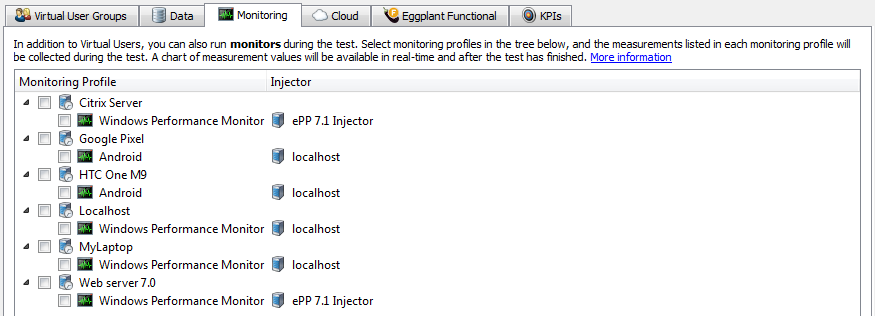
On the Test view, click the Monitoring tab. A tree of monitoring targets and the monitoring profiles they contain opens:

The second column of the tree shows the injector on which the monitor will run during the test.
-
Select the check box by a monitoring profile item.
If you select the check box by a monitoring target item, all monitoring profiles which apply to that monitoring target will be selected.
To view or edit a monitoring target or monitoring profile in the tree, you can right-click the item and select an option from the menu that appears. Each selected monitoring profile will use one of the engine TCP ports from the range defined on the Basic Settings tab as described in Configuring Static Injector Families. Therefore, the range must be large enough to accommodate both engines and monitors.