Real-Time Test Monitoring in Test Controller
After you start a test in Eggplant Performance Test Controller, you can view real-time monitoring statistics in the Test Controller main window. Test Controller has many metrics available to view for your tests, but keep in mind that not all metrics are applicable to all tests.
When you run a test for the first time, Test Controller shows a default set of metrics in the main window. However, you can customize the layout to display tables and charts to suit your requirements. You can also arrange how the metrics appear in Current test run tab, or open them in their respective windows. Customized charts and window layouts can be exported to a file, and then imported when running the test again later, or when running different tests. For more information, see Eggplant Performance Test Controller User Interface.
Monitoring Metrics in Test Controller
The metrics available to you are found in the Current test run panel, usually situated on the left hand side of the window. Note that Eggplant Performance Analyzer provides more complete data analysis of your performance tests after they are complete. However, the live monitoring available in Test Controller offers a useful view of the health and progress of your virtual users (VUs) and tests overall.
Where possible, Test Controller shows how your test is performing against KPIs that are defined in Studio. See Viewing KPI Statistics In Test Controller for more information.
To open a metric, navigate to it on the left pane, then double-click it to add it to the main view. You can also right-click the metric for additional options:
- Open: Same as double-clicking, this opens the metric in the Current test run tab.
- Open maximized: This option opens the metric in the Current test run tab at its maximum size, which fills the tab and covers any other open metrics. To return a maximized metric to normal size within the tab, click the cog wheel icon on the metrics header, then select Restore view.
- Open in new window: Opens the selected metric in a separate window.
- Close: Closes the selected metric. This option is enabled only for metrics that are already open.
If the Current test run tab is already full of other metric views, the Open and Open maximized options open the metric in a new window instead.
Below are explanations of the metrics available for test run monitoring in Test Controller. Remember that more complete test analytics are available in Eggplant Performance Analyzer after the test completes.
Alerts
The Alerts metric is a single report in table form that lists alerts raised during the test run. Note that this is the same report that appears if you click the Alerts area of the toolbar. Alerts are typically used to notify users about general errors that do not pertain to a particular VU. Some Alerts you might see include:
- Lost network connection to a remote injector.
- Failed to send a command (such as a request to stop the test) to a remote injector.
- An engine running on an injector has exited unexpectedly.
VU Concurrency
This metric is a single time series chart that shows how many virtual users (VUs) are running at any given time during the test. It also shows any VUs that have an error status and those VUs that have completed running.
Injector Status
This metric is a single report that includes a tree view for injectors in the current test with a table view to show status and other information.
This report includes data only while a test is running.
KPIs
This view is a table view that shows how the test is performing against the KPIs defined in Studio. The metrics displayed depend on the KPIs you have set for the test. KPIs that meet their target criteria are displayed in green, and those that are failing are shown in red.
Virtual User Groups
This collection of metrics provides information relating to the performance of the virtual user groups and individual VUs assigned to the test. Within the collection, you'll find the Virtual user group summary metric, which is a table of data about each VU group in the test, as well as an additional collection of metrics about each specific VU group.
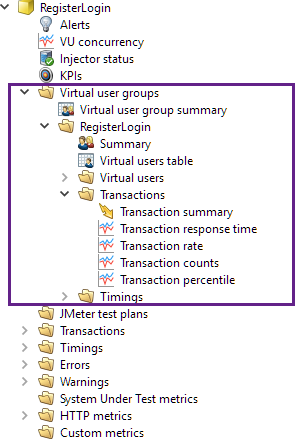
Transactions
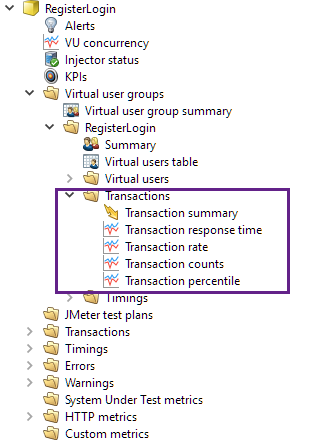
The Transactions section includes metrics that measure the performance of individual transactions in the test, tracked across all VUs. You can view transaction metrics for individual VU groups as shown in Virtual User Groups.
Transaction data for tests is available only if you have included transactions within the test script.
Transaction percentiles that are calculated while the test is running are only an approximation, as they are calculated from a small sample of the full data set.
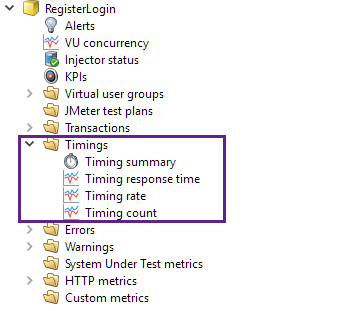
Timings
The Timings section provides metrics that measure the performance of individual timings in the test, tracked across all VUs. (You can view timings metrics for individual VU groups in the Virtual user groups section.)
Timing data for tests is available only if you have included timings within the test script.
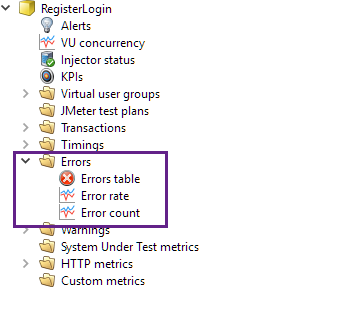
Errors
The Errors section includes a summary table and charts to show the rate and count of errors in the test.
Warnings
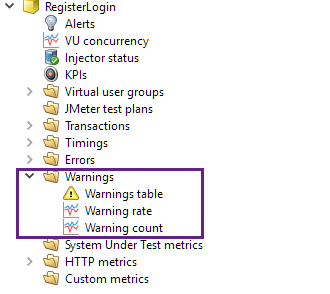
The Warnings section includes a summary table and charts to show the rate and count of warnings raised by the test.
System Under Test metrics
These metrics are available if you have established monitoring targets in Eggplant Performance Studio for the given test. For information about setting up monitoring targets, see Monitoring.
HTTP Metrics
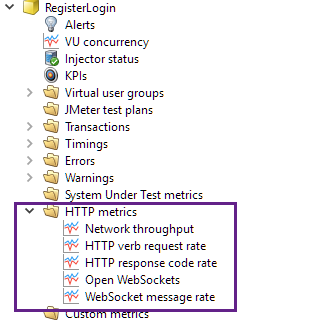
The HTTP metrics section includes statistics that apply only to web tests.
Custom Metrics
If you have created user-defined metrics for a test, they are found in the Custom metrics section. For information about creating user-defined metrics, see Custom Metrics in Test Controller.
Previous Test Runs
You can review metrics from previous test run in Test Controller. You access the metrics reports in the Previous test runs panel, which is usually situated on the left side of the window. Tests are organised within series, which are chosen as the test begins.
To review previous test run data, navigate in the tree to the series and test you want to review, then select the metrics. The same metrics you can view during live test monitoring are available to review for past test runs. (Note, however, that some metrics, such as status reports, contain data only while a test is running.)
When you open a table or chart for previous test runs, the metrics open in the Previous test runs tab of the main Test Controller window. You can customize the layout of this tab just as you can the Current test run tab.
You can open metrics from different test runs at the same time. The header bar for the metric show which test the data belongs to.
For a more complete post-run analysis, use Eggplant Performance Analyzer.