Creating an Analysis View in Eggplant Performance Analyzer
When you've chosen a test run to analyze in Eggplant Performance Analyzer, you're ready to take the next step in test run results analysis by launching the Create an Analysis View wizard. Right-click the test run in the Project tree and select New analysis view from the drop-down list. The wizard guides you through the process of creating a view for the test run.
You can also launch the Create an Analysis View wizard by selecting the test run in the Project tree, then clicking the New analysis view button on the Eggplant Performance Analyzer toolbar.
Choose a Time Slice of the Test Run
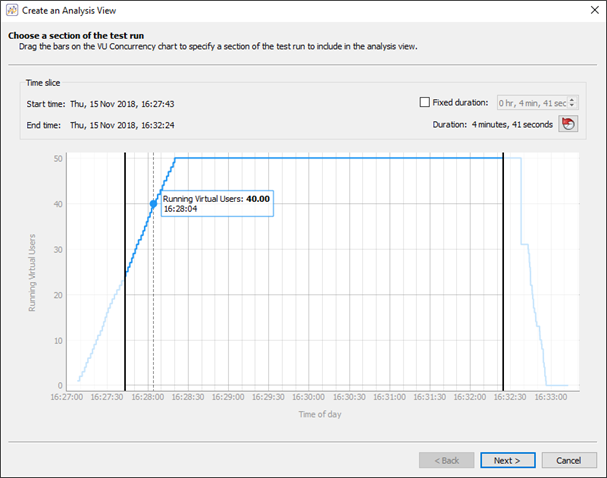
The first screen in the Create an Analysis View wizard lets you determine how much of the overall duration of the test run you want to include in your analysis view results. For example, you might want to limit the analysis view to a period of maximum virtual user (VU) concurrency.
This screen of the wizard displays the VU activity in a simple time slice graph, showing the number of VUs running over time. If you hover the cursor over any point on the graph, a pop-up shows the number of VUs running at that instant.
 Choosing a time slice in the Create an Analysis View wizard
At each side of the graph, you'll see a vertical black bar. To adjust the time slice for the analysis view, click and drag the black bars where you want them on the chart. The initial setting of these bars is to use the entire test run for the analysis view. If you want to use the whole test run, you don't need to make any adjustment on this screen.
You can set a fixed duration for the time slice by selecting the checkbox on the upper right side of the graph, then setting the amount of time you want to use for the duration. With a fixed duration set, the black bars remain fixed with that time interval set so that if you move one bar, the other bar moves as well. A Reset button next to Fixed Duration resets both the Fixed Duration control and the black vertical bars back to the default duration of the test.
When you're satisfied with the time slice, click Next.
The Fixed Duration control can not be increased to a time greater than the duration of the test.
Choose an Analysis Template
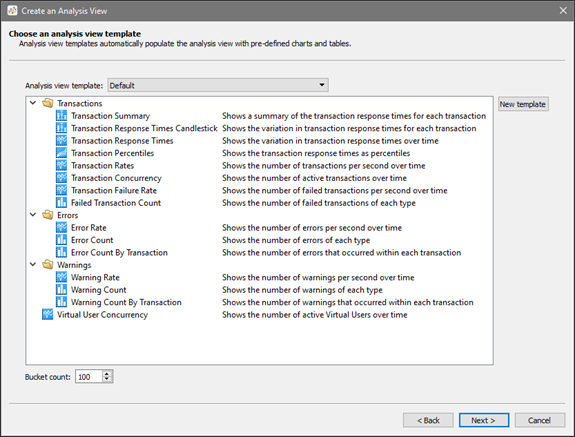
The next page in the Create an Analysis View wizard is where you determine what charts the analysis view includes, which you manage by assigning an analysis view template. Eggplant Performance Analyzer has a Default analysis template defined by default, which includes many common charts used in performance analysis.
The Default analysis template is selected by default. However, if you've defined other analysis templates, you can select them from the drop-down list. The chart templates that are defined as part of the currently selected analysis template are listed in the window below the drop-down list. You can also choose to create an analysis view with no template, which means the analysis view will open with no charts.
 Choosing an analysis template in the Create an Analysis View wizard
To define a new analysis view template
-
From the Create and Analysis View wizard, click New template on the right side of the window. For more information, see Analysis Templates in Eggplant Performance Analyzer.
-
When you've chosen the analysis template, click Next.
Apply Groupings to the Analysis View
Grouping is an optional feature in Eggplant Performance Analyzer that lets you treat multiple items or events as if they were the same, despite subtle differences. You can define groupings in the Create an Analysis View wizard or elsewhere in Analyzer. For a full description of groupings, see Using Grouping in Eggplant Performance Analyzer.
If you've previously created groupings, you'll see them here in the wizard and can apply them to the analysis view. Because groupings are sorted into categories (e.g., Errors, Transactions, and so forth), you might need to switch the drop-down list to the correct category to see your groupings.
The wizard shows the name of each defined grouping along with its definition. To apply an existing grouping to the analysis view, select the checkbox beside the grouping name.
From this screen of the wizard, you can create new groupings by clicking Manage groupings on the right side of the window. To learn how to create groupings, see Using Grouping in Eggplant Performance Analyzer.
Grouping is an optional feature; you don't have to select anything on this screen. When you're satisfied with your grouping choice, click Next.
Adjust Sample Size & Name the Analysis View
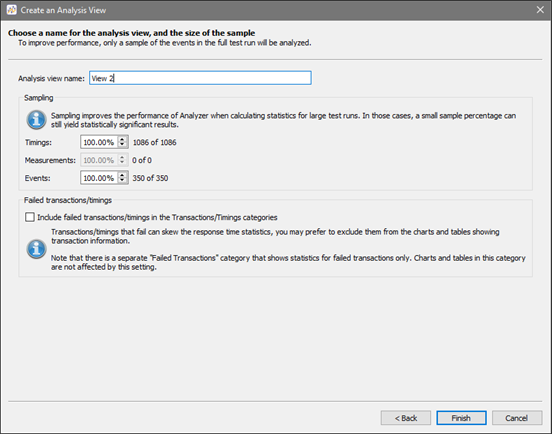
The final page of the Create an Analysis View wizard includes a few different options. First, you need to enter a name for the analysis view. Choose a descriptive name that indicates what information the view presents.
Next, you can set your options for transaction sampling.
 Setting transaction sampling and other options in the Create an Analysis View wizard
Transaction Sampling
If your test run contains a large number of transactions and timings, you might want to include only a percentage of them in the analysis view. The accuracy of some calculations is reduced but sampling when faced with large amounts of data is a valid statistical method and can improve Analyzer performance.
You can select the percentage value you want to use for Timings, Measurements, and Events. Note that the total number available in the test for each is shown to the right of the input box. When you update the percentage, the numbers update to show how many items of the whole the analysis view will include.
Failed Transactions/Timings
When a timing or transaction fails because it contains an error or has been explicitly failed, it can skew the response time statistics. For example, some types of errors might occur immediately after a request has been sent, thus lowering the mean response time if included in response time calculations.
Select the Include failed transactions/timings in the Transactions/Timings categories checkbox only if you want to include these transactions in your analysis. More often than not, you can leave this option unchecked to exclude failed transactions/timings from response time calculations.
Completing the Create an Analysis View Wizard
While using the Create an Analysis View wizard, you can use the Back button to return to previous steps to review your choices or make different ones. When you're satisfied with the options for your analysis view, click Finish on the final screen to create the analysis view.
The new analysis view appears under the test run in the Project tree with the name you provided in the wizard. Keep in mind that you can create multiple analysis views of a test run with different options, and therefore containing different charts and analysis options.