The Eggplant Performance Analyzer User Interface
Eggplant Performance Analyzer is built around a two-pane user interface (UI). Test run data, analysis views, and related items are listed in the Project tree in the left sidebar. When you select an item in the Project tree, relevant details about that item display in the Viewer pane on the right, allowing you to take additional actions.
 The Eggplant Performance Analyzer UI
Eggplant Performance Analyzer, like Eggplant Performance Studio, is project based. You will import individual test runs to work with, but Analyzer will respect the project and workspace designations established in Studio. If you switch the project (or workspace), the data you see in Analyzer switches as well.
Eggplant Performance Analyzer Project Tree
When you open a project or import test runs, the test runs are displayed in the Project tree. From this section, you can view summary data about test runs and select them for analysis.
After you've processed test run results, the analysis view for that data appears within the Project tree. From the analysis view, you can select charts, data tables, and other information about the test run for display in the Viewer pane. For information about creating an analysis view, see Creating an Analysis View in Eggplant Performance Analyzer.
The Project tree also contains Analysis Templates, Report Templates, and Chart Templates, which you can use to customize and standardize data views and analysis. You can also establish Key Performance Indicators (KPIs), which can then be applied to test run data, and you can use the Comparisons section to compare data from different test runs. Each of these features is described in its own section:
- Creating an Analysis View in Eggplant Performance Analyzer
- Reporting with Eggplant Performance Analyzer
- Creating Charts in Eggplant Performance Analyzer
- Key Performance Indicators (KPIs) in Eggplant Performance Analyzer
- Comparing Analysis Views in Eggplant Performance Analyzer
Eggplant Performance Analyzer Viewer pane
The Viewer pane displays analyzed data and other details about items selected in the Project tree. You can use this area to further configure charts and data, providing a more focused presentation of the test run results. See Working with Eggplant Performance Analyzer Charts for more information.
Eggplant Performance Analyzer Toolbar
The Eggplant Performance Analyzer toolbar provides context-sensitive options for working with your test run data and other features in the Project tree. That is, you'll see different buttons on the toolbar depending on what you select in the tree.
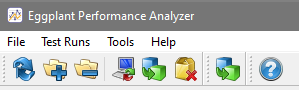 The Eggplant Performance Analyzer Toolbar
The buttons on the left side of the toolbar are always the same:
-
Refresh: Gives you a refreshed view of all items in the Project tree.
-
Expand all/Collapse all: Expands or collapses all the nodes in the Project tree.
-
Switch current workspace/project: Opens a dialog box that lets you choose a different workspace and project.
-
Analyze test run: Opens the Test Run Browser so that you can retrieve individual test runs to use in Analyzer.
noteIf you use this option to import a test run from a different project or workspace than the one currently in use, Analyzer switches automatically to the project and workspace of the imported test run. For more information on importing test run data, see Getting Started with Eggplant Performance Analyzer.
-
Delete project: Lets you select a project to remove from Analyzer, including all the project's test runs and data; requires confirmation.
The Help button is always available on the far right as well. Use this button to open Eggplant Performance Analyzer help topics.
When you select an item in the Project tree, the toolbar displays buttons in the middle section for tasks specific to that item. For instance, in the toolbar image above, the middle section shows buttons for Rename chart template and Delete chart template because a chart template is selected in the Project tree. (To see what a button does, hover your cursor over it to display a tool tip description.)
Most options that are available as context-sensitive buttons are also available if you right-click an item in the Project tree.
Using the Analyzer Menu Bar
Most of the options you can find on the Eggplant Performance Analyzer menu bar are also available on the toolbar or right-click menus. However, some functions can only be accessed through the main menus.
File Menu
- Refresh: Gives you a refreshed view of all items in the Project tree.
- Switch current workspace/project: Opens a dialog box that let's you choose a different workspace and project.
- Analyze test run: Opens the Test Run Browser so that you can retrieve individual test runs to use in Analyzer.
- Delete project: Opens the Delete project: Lets you select a project to remove from Analyzer, including all the project's test runs and data; requires confirmation.
Tools Menu
- Logged in clients: This option shows any clients logged in to the database. You can use this log out or unlock an analysis database that has become locked and inaccessible through the Project tree.
- Manage groupings: Launches the Manage groupings dialog box. For information about groupings in Analyzer, see Using Grouping in Eggplant Performance Analyzer.
- Preferences: Opens the Analyzer Preferences dialog box. You have a couple of settings you can choose here:
- Default bucket count: The bucket count is set to 100 by default; you can change that value here to use a different default value. The bucket count is used to limit the number of data points that get plotted on charts.
- Display elapsed time instead of clock time on charts: Select this checkbox if you want to display elapsed time (i.e., how long the test has run) across the x-axis of your charts. Otherwise, charts display the clock time (i.e., the time recorded when the test was run).
Additional Menus
In between the File menu and the Tools menu, you might see an additional menu. When you select a node in the Project tree, context-sensitive menus appear on the menu bar, just as context-sensitive buttons appear on the tool bar. The menu and the options available on the menu vary depending on what you have selected.
In addition, you can always find the Help menu on the right. This menu provides the following links:
- Eggplant Performance Analyzer help: Takes you to the full Analyzer documentation.
- Get support: Takes you to the Eggplant Support site, where you can find FAQs, tutorials, and user forums.
- View current log file: Opens the log file in Notepad for your review.
- Dump Analysis database: This option should generally be used for troubleshooting only if directed by Eggplant support.
- About Eggplant Performance Analyzer: View version and copyright information as well as release notes and credits for Analyzer.