Working with Eggplant Performance Analyzer Analysis Views
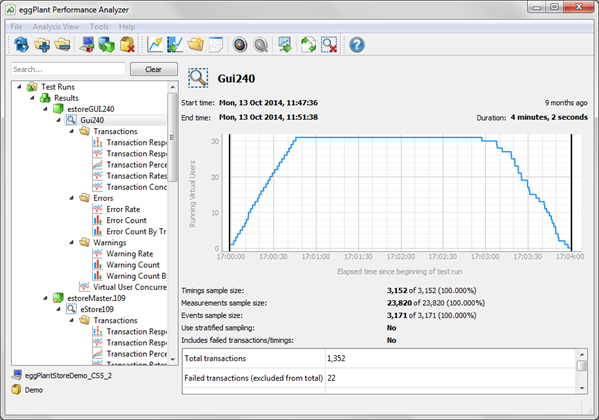
When you create an analysis view in Eggplant Performance Analyzer, it appears in the Project tree under the test run you analyzed. Under the analysis view, you'll find the specific charts that make up the view. Select the analysis view in the Project tree to see summary details of the analysis view in the Viewer pane:
 Analysis view summary information in Eggplant Performance Analyzer
Note that if KPIs have been added to the test run to which this analysis view relates, that information appears at the bottom of the summary. Remember that KPI collections are created and attached to test runs in Eggplant Performance Studio. For more information about KPIs, see KPIs in Eggplant Performance Studio.
Working with the Analysis View
With a view selected in the Project tree, the middle section of the toolbar displays buttons that let you perform actions on the analysis view as a whole. Note that you can access the same actions by right-clicking the analysis view in the Project tree.
![]() Context toolbar for an analysis view inEggplant Performance Analyzer
Context toolbar for an analysis view inEggplant Performance Analyzer
Hover your cursor over any button for tooltip text that explains the button function.
-
New chart: Use this option to add a new chart to the existing view. The Create a Chart wizard walks you through the options for the type of chart and data you want to present. When you complete the wizard, the new chart appears at the bottom of the view.
noteThis option doesn't change the analysis template (if one is applied); it only adds the new chart to the analysis view.
-
New chart from template: This option lets you create a chart from an existing chart template and add it to the current analysis view.
-
New folder: You can add new folders to the analysis view to organize your charts.
-
Apply analysis template to view: This option lets you apply an additional analysis template to the current view. In the Select Analysis Template dialog box, choose the appropriate template from the drop-down list; you can also choose to define a new template by clicking New Template. For more information about analysis templates, see Analysis Templates in Egglant Performance Analyzer. When you apply a new template to an analysis view, the new data appears at the bottom of the analysis view.
-
Create report: Use this option to open the Create Report dialog box, which lets you generate a report either from the current view or from a different analysis template. For more information about creating reports, see Reporting with Eggplant Performance Analyzer.
-
Rename analysis view: Use this option to rename or edit the analysis view name.
-
Delete analysis view: This option deletes the analysis view from the Project tree; requires confirmation.
If you right-click on the summary chart, you'll find these additional options:
- Zoom in/Zoom out/Original size: Use these options to enlarge the view of the chart (Zoom in) or make the view smaller (Zoom out). Original size returns the chart to its full-size view. Note that you can also use your mouse scroll wheel for zooming.
- Copy image to clipboard: Charts can be copied to the clipboard so that you can paste them into other applications, such as Microsoft Word. All visible chart elements are copied, including any labels or values along either axis.
- Export as PNG: Similar to copying to the clipboard, this option lets you create and save a
.png(image) file containing the chart. All visible chart elements are copied, including any labels or values along either axis.