Getting Started with Eggplant Performance Analyzer
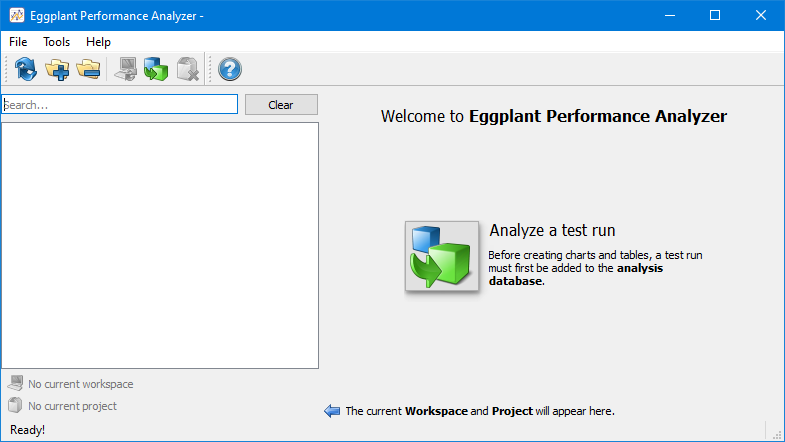
Eggplant Performance Analyzer is the analysis portion of Eggplant Performance, Eggplant's load and performance testing tool. When you launch Analyzer for the first time, you see the Welcome screen.

You must add test run data to Analyzer in order to create charts and tables for analysis. In fact, you might want to include many different test runs or tests from multiple projects that you've created in Eggplant Performance Studio and Test Controller.
To get started, click the Analyze a test run button in the center of the Welcome screen, which opens the Test Run Browser. Note that the Analyze test run button is also available on the Eggplant Performance Analyzer toolbar so that you can always add new test runs while you're working in Analyzer.
Using the Test Run Browser
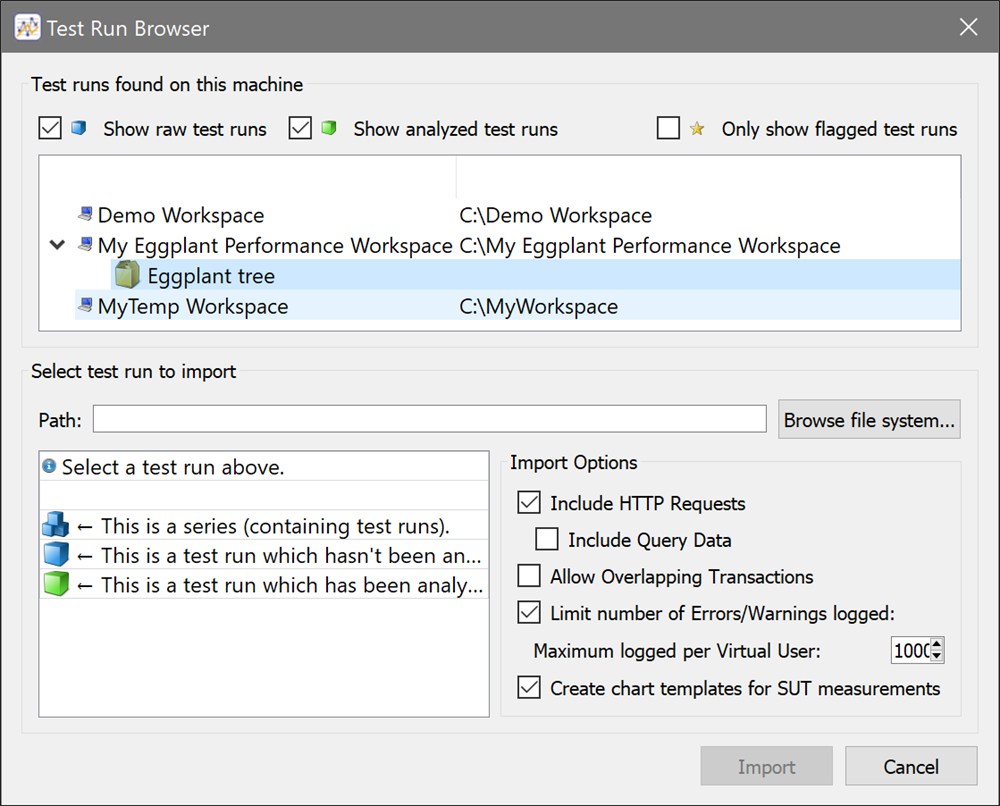
The Test Run Browser automatically locates any Eggplant Performance workspaces on the local computer and displays them on top half of the window. You can navigate into any workspace down to the specific test run you want to add to Analyzer.
The tree structure in the browser duplicates the structure you have established in Eggplant Performance Studio: Workspace > Project > Test series > Test run
Raw test runs (e.g., unimported) are represented by a blue cube icon. Test runs that you've added to Analyzer show as green cubes. In addition, the test run displays the date and time that the test run took place, as well as how long ago it was. If you select a test run in the tree, the center pane in the bottom half of the Test Run Browser shows you additional information about the test run.
 Use the Test Run Browser in Eggplant Performance Analyzer to import test run data
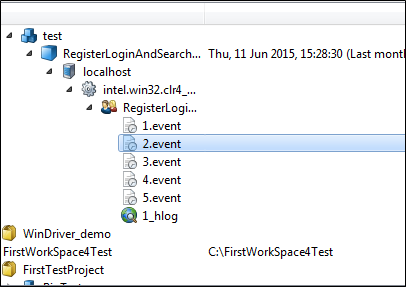
Note that you can browse in the tree beyond the level of the test run, where you can see the injectors, virtual user (VU) groups, and event logs and web logs from the test run.

To view event log information, right-click the item you want to view and select Open event log. To view a web log, right click a web log item and select Open web log. Although you might not need to review this information, you could find it useful for troubleshooting. (This information is also available in Eggplant Performance Test Controller.)
View and Import Options
At the top of the Test Run Browser, you'll find checkboxes for filtering the test runs that display in the window. Select an item's checkbox to display it in the tree below. Note that Show raw test runs and Show analyzed test runs are both selected by default so that all test runs display initially.
The third filter option is Only show flagged test runs. Use this option if you have test runs that you flagged for analysis in Test Controller. With this option selected, only test runs that were flagged will display in the tree. (Note, however, that you can still filter flagged test runs based on raw or analyzed test runs, if desired.)
At the bottom right side of the Test Run Browser, the Import Options section lets you allow or exclude certain types of information when you import the test run data. Your choices are:
-
Include HTTP Requests: Select this option if you need statistical analysis of HTTP requests. However, you can clear this checkbox to use only standard response data, which is typically sufficient and will result in a smaller database and quicker import time.
-
Include Query Data: Select this option if you need all requests with a common URI but different query data to be treated as unique requests. If you clear this checkbox, all requests with a common URI will be treated as one request, resulting in a smaller database, created more quickly.
noteThis option is available only if you select Include HTTP Requests; if you exclude HTTP requests, you're also excluding all query data.
-
Allow Overlapping Transactions: An overlapping transaction starts after another transaction has started (but hasn't completed), and ends after that other transaction has ended. Select this option if the test contains virtual users (VUs) that are multi-threaded or where a VU contains event-driven transactions. Otherwise, you can clear this checkbox; if overlapping transactions are encountered, they will be discarded and a process warning is raised.
-
Limit number of Errors/Warnings logged: Use this setting to limit the number of errors and warnings stored in the analysis database. If you select this checkbox, you can set the number in the Maximum logged per Virtual User field. Restricting the number results in a smaller database, created more quickly.
noteIf you use this setting, overall error/warning statistics will still be available, for example, for error rates.
-
Create chart templates for SUT measurements: If this option is selected, Analyzer creates a chart template for each SUT measurement that is found in the imported test run (if the chart template does not already exist). For information about charts and chart template in Analyzer, see Creating Charts in Eggplant Performance Analyzer.
In addition, see tips on running large tests in Analyzer.
Adding Test Runs to Analyzer
When you have selected the test run you want to add to Analyzer, along with the appropriate import options, click the Import button on the bottom right side of the Test Run Browser. The test run is processed and added to the analysis database.
Note that you also have an option to Browse file system. You can use this option if you have test run data that is not on your local machine (but is accessible via browse). Locate the TestAudit.xml file within the runs directory to add the test run to Analyzer with this method.
Using the Getting Started Page in Eggplant Performance Analyzer
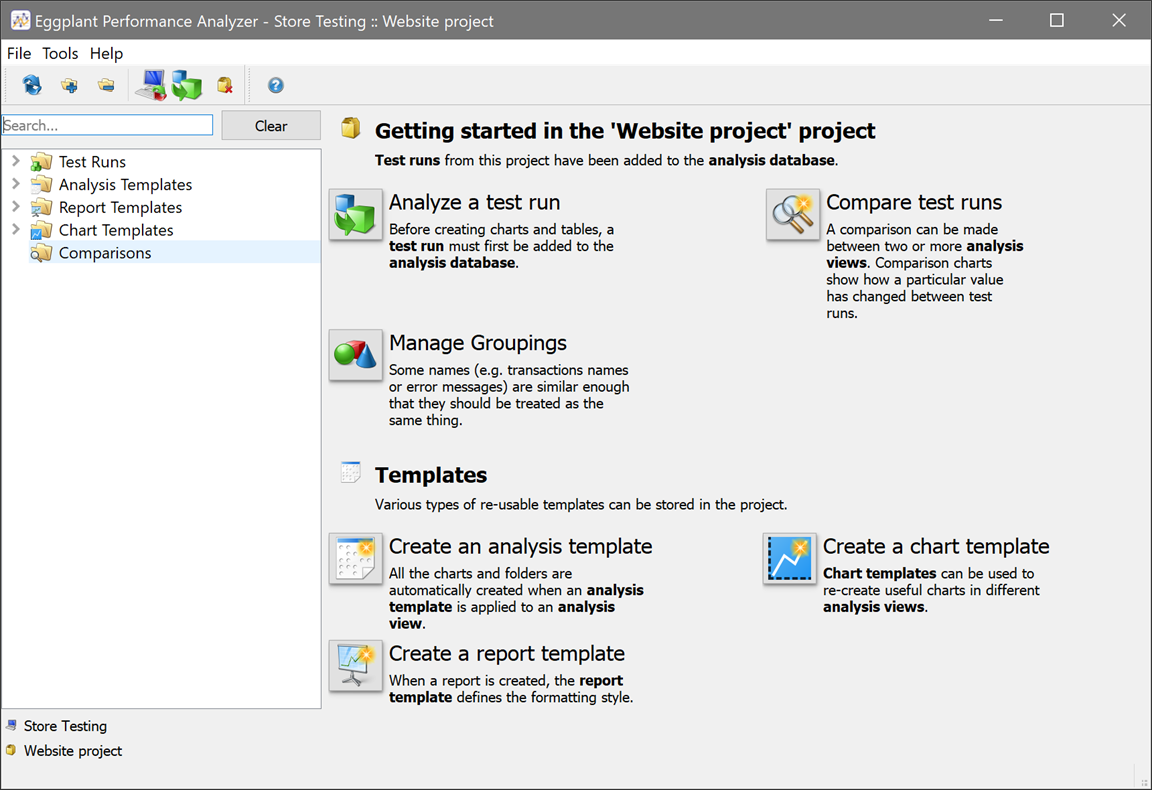
After you have test run data added to Eggplant Performance Analyzer, you can use the Getting started page to access many of the features and templates you will use throughout Analyzer.

The Getting started page provides the following shortcuts:
Getting started
-
Analyze a test run: This button opens the Test Run Browser, as described above, allowing you to add additional test runs to Analyzer.
-
Manage Groupings: Use this option to open the Manage Groupings dialog box. For information about using groupings, see Using Grouping in Eggplant Performance Analyzer.
-
Compare test runs: You can create a comparison between two or more analysis views, which you can use to see how the performance of your tested systems has changed over time. Use this button to open the Compare Multiple Views dialog box. See Comparing Analysis Views in Eggplant Performance Analyzer for information about comparing analysis views.
Templates
-
Create an analysis template: You use an analysis template to apply charts and folders to an analysis view. Use this button to open the Create Analysis Template dialog box. For information about creating analysis templates, see Step by Step: Creating an Analysis Template.
-
Create a report template: When you generate a report, a report template defines the formatting style. Use this button to open the Create Report Template dialog box. For information about creating report templates, see Step by Step: Creating a Report Template.
-
Create a chart template: You can use chart templates to re-create charts in different analysis views. This button launches the Create a Chart Template wizard. See Chart Templates in Analyzer for information about creating chart templates.
The Getting started page displays each time you launch Analyzer (unless you haven't added any test run data, in which case you see the Welcome screen instead). The Getting started page also displays anytime no nodes are selected in the Project tree. However, you can access the features and templates available here from the Project tree, toolbar, or main menu.