Debugging Virtual User Scripts
After you have created your test and you have added virtual users (VUs) to it, you might want to verify that the virtual user scripts are working properly. You can use Eggplant Performance Test Controller for this action, but you could instead use an integrated development environment (IDE), if you have one configured. See Compilers and IDEs for detail about setting this preference.
The benefits of using an IDE are the ability to set breakpoints and "watching" variables. See 7 Ways to Look at the Values of Variables While Debugging in Visual Studio for more information. For example, you might want to view all of a given response object's properties rather than writing out specific values in the VU's event log.
Before debugging your virtual user scripts, make sure you have specified an IDE for the language you are using in the Eggplant Performance Compilers and IDEs preferences.
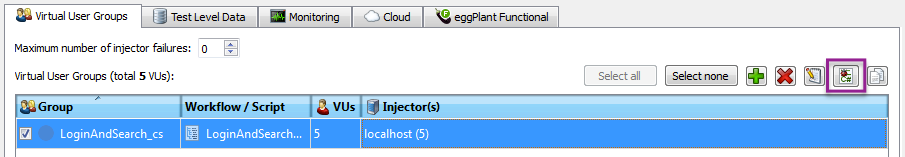
To debug a virtual user group, navigate to the test and select the virtual user group from the list. Then, click the Debug VU Group icon in the upper right portion of the Virtual User Groups tab, which opens the relevant IDE specified in the Compilers and IDEs preferences (i.e., Eclipse for Java, Visual Studio for C#).
When you click Debug VU Group, Eggplant Performance creates a new project in the IDE of your choice for that test. You can debug your test script or virtual user script by setting breakpoints in the IDE, then running the script.
When you run or debug a script in the associated IDE, the VU web log or VU event log opens in Eggplant Performance and updates live as the script executes.
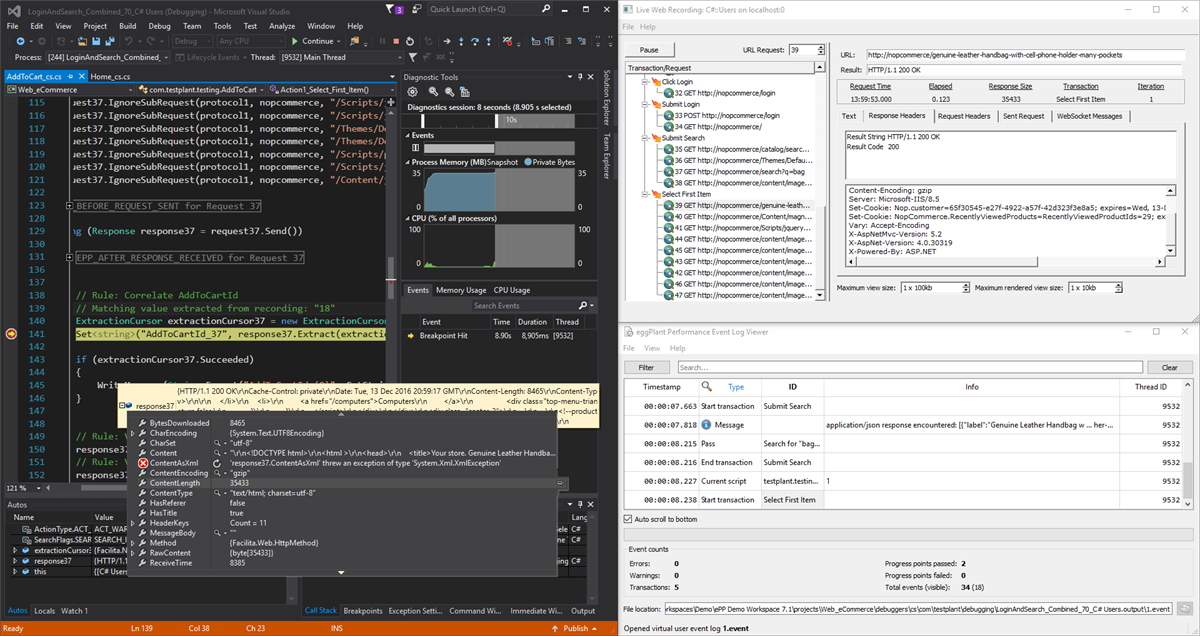 Microsoft Visual Studio IDE with Eggplant Performance Studio, debugging a script.
When the script is run in the IDE, most of the virtual user group settings are preserved. However, some are overridden:
- Iterations: The script executes only once.
- Ramp-up: Only one VU will run.
The debug option works by generating a source code file containing all the runtime options, data options, and so forth, for the VU group in question. Therefore, the debug project in Visual Studio or Eclipse contains these settings as they were at the time the debug project was created (i.e., when the Debug VU Group button was pressed). The project is effectively a snapshot in time of the test. If you change any of the test options, you must regenerate the source code file by clicking Debug VU Group again.