Using the Eggplant Monitoring API
The Eggplant Monitoring API is predominantly a data extraction tool that allows users to directly access and extract test results through standard HTTP requests in formats such as XML, JSON, PHP, or YAML. API data requests can be used in anything from reporting spreadsheets to live reporting applications. The API is the recommended solution for advanced Eggplant Monitoring customers to import live and historic data. To view sample API queries, see Eggplant Monitoring Query Examples.
The API also can be used to update your monitoring configuration. This functionality is explained in Write Functionality in the Eggplant Monitoring API.
On this page:
- API Basics
- Using an API Key
- Using Persistent Personal Access Tokens
- Using the Query Builder
- Reading the Query Response
API Basics
You make queries to the Eggplant Monitoring API in the form of HTTP requests. Design and fine-tune your queries using the API user interface. Depending upon your requirements, you can either run this query manually as required or build an application to call the programmatically. Your can design your applications to refine the extracted data further if required and present it in the format that suits your exact needs.
To use the API user interface:
- Access the API user interface at https://api.mon.eggplant.cloud.
- Log in with your standard username and password. Eggplant Monitoring generates an API key to validate your session.
- Construct your query.
- Run your query.
- Check to see that the query returns the desired data.
- (Optional) Modify and re-run your query until it returns the data you require.
Using an API Key
After you log into the user interface, the API uses a key to maintain your session. The key, or token, is unique to each session and is an essential component of the query URL that is sent to the API.
The key remains valid for 60 minutes since last use. This means a session can last indefinitely if the key is used a minimum of once every 59 minutes. If the key expires, log out and then login again to re-authenticate and generate a new key.
The API key automatically expires if the account’s access to the API expires or is removed. Should this happen unexpectedly, contact your account manager or support.
You can force a key to expire using a URL request in a browser. For example, if you were assigned key abcdefghijklmnopqrstuvwxyz123456 and needed to force it to expire, the URL request would be:
https://api.mon.eggplant.cloud/current/abcdefghijklmnopqrstuvwxyz123456/Logout
Your API key, or token, belongs to you. Make sure you know how it is used by other users and resources within your organization. If you need greater control over API access, consider using persistent personal access tokens. If you think that any of your API tokens have been compromised, revoke them immediately.
Using Persistent Personal Access Tokens
Think about using persistent personal access tokens if:
- Your organization connects to the API less frequently - less than once an hour
- You need to control and track access to the API from multiple users or resources.
You can create a token for each user or resource, with either read or full read and write access to the API. Each token is valid for between one and seven days. In the same way as an API key, the personal access token expires if it is not used at least once within the specified lifetime. The lifetime of the token is refreshed and extended every time it is used.
Create a Persistent Personal Access Token
Create a persistent personal access token for each user or resource that needs to access the Eggplant Monitoring API.
-
On the API landing page, click Show to display the Manage the Persistent Personal Access Tokens section.
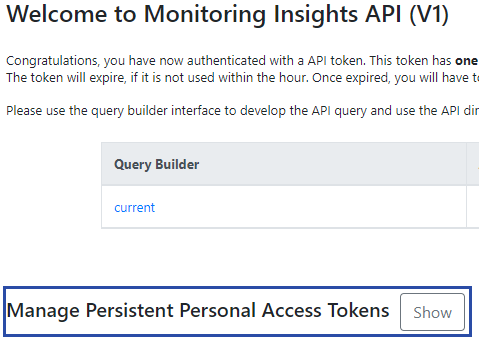
Welcome to the Monitoring Insights API (V1)
-
Enter a unique Token Name, and select the required Inactivity Lifetime for the token.
-
Under Scope, select the Allow updates (Account admin only) checkbox to grant the token full read or write access to the API. Only users with administrator rights to their portal account can use these access rights. Otherwise the token gives read-only access.
-
Click Create to generate the personal access token.
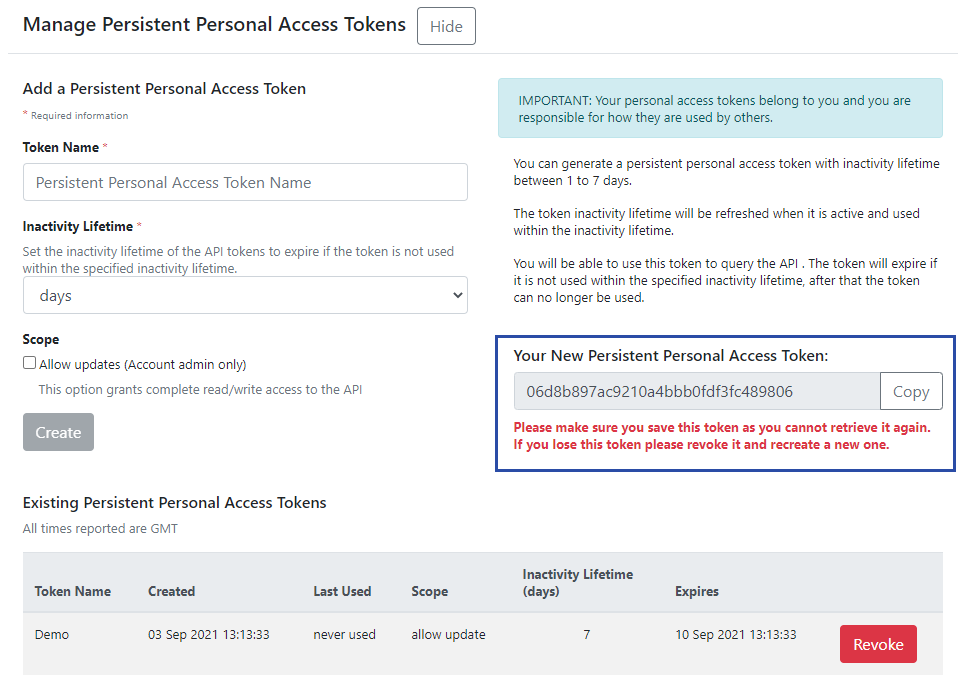
Manage Personal Access Tokens
-
When the personal access token appears, copy and save it to a secure location.
View Active Tokens
Use the Existing Persistent Personal Access Tokens table, at the bottom of the Manage the Persistent Personal Access Tokens section, to view and monitor the status of each active token.
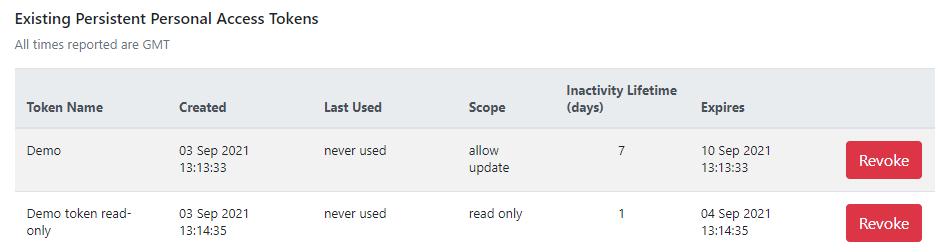
Existing Persistent Personal Access Tokens
The following details are displayed for all tokens:
| Attribute | Description |
|---|---|
| Token Name | Name of the token that was entered by the user |
| Created | Date and time when the token was generated |
| Last Used | Date and time when the token was last used to access the API |
| Scope | Type of access that is granted by the token, either read only or allow update |
| Inactivity Lifetime (days) | How many days the token can remain inactive before it expires. To change this value, revoke and recreate the token. |
| Expires | Date and time when the token is due to expire. Every time the token is active, this value is refreshed and extended. |
Revoke an Active Token
You can revoke any active tokens immediately.
- On the API landing page, click Show to display the Manage the Persistent Personal Access Tokens section.
- Go to the Existing Personal Access Token table.
- Find the active token that you’re interested in and click Revoke next to it.
- Click OK to confirm.
Using the Query Builder
In order to return the specific data you require from the API, the query URL needs to include values that filter the results data. In the Query Builder UI, you select filters for the data you require. The Query Builder tool then constructs the correct query URL for you.
Accessing the Query Builder
Go to the API user interface starting page at https://api.mon.eggplant.cloud and log in using your Eggplant Monitoring username and password. Your API key is generated when you log in.
You must have API privileges associated with your user account to access the API. If you're not sure if your account has API privileges, contact your account manager.
After you log in, click current under Query Builder to open the Query Builder UI.
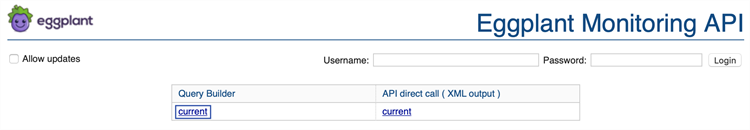
The Eggplant Monitoring API interface
The Query Builder opens in a new tab or window, depending upon your browser settings.
If you select current under API direct call, you are issued an API key and can build queries without the assistance of the Query Builder.
Using the Query Builder
When you first access the Query Builder, the URL displayed at the top of the interface defaults to the URL of the API appended with your assigned API key. As you construct the query, the URL changes to reflect your choices.
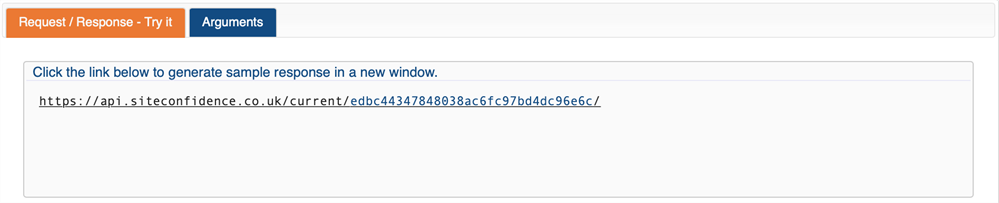
The Default URL displayed when the Eggplant Monitoring Query Builder is first accessed
The Query Builder screen also displays the API key that was generated for you for the current session. This key is valid for 60 minutes from its last use.
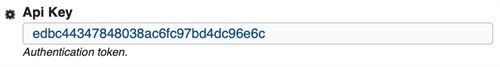
The API key field in the Eggplant Monitoring Query Builder
If the Query Builder becomes unresponsive when you're trying to select test or data, your key might have expired. Try refreshing the screen. If a 401 authentication failure message displays, the key has expired, and you'll need to log in to the API again to generate a new one.
Specifying Test Filters
The test filters are the fields on the left side of the Query Builder interface. These filters allow you to define the monitoring tests in which you are interested. Note that the more specific the criteria you select, the faster the query will run.
Click Arguments to display all of the available filters and their descriptions on a single page.
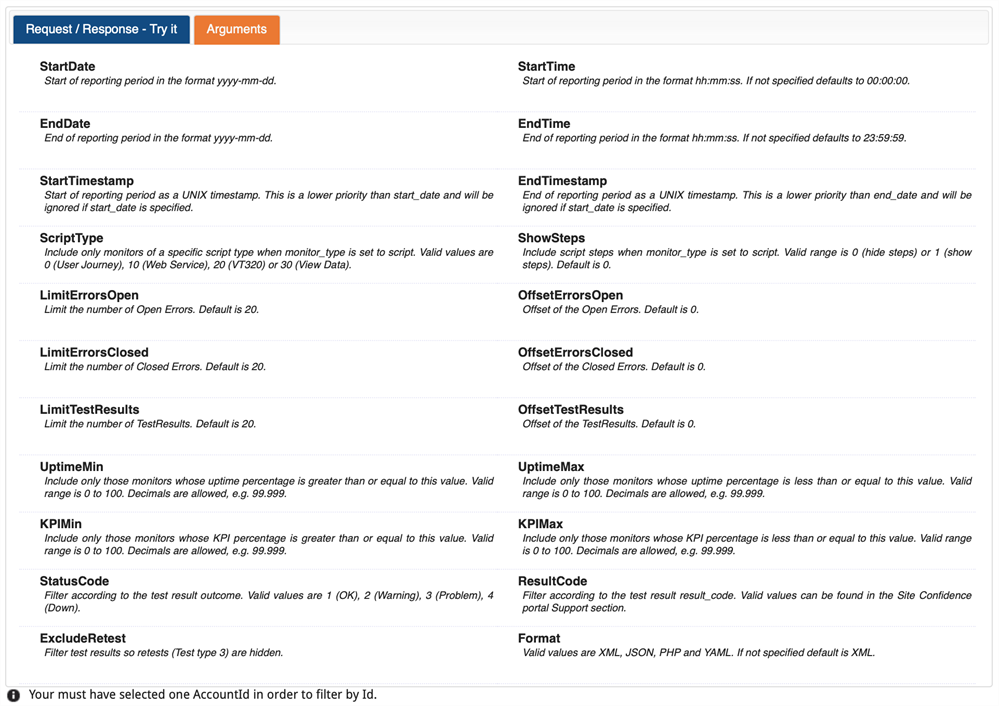
The Eggplant Monitoring Query Builder arguments
Query Filter Fields
The Query Builder has extensive filtering options for your queries. The options described below are the most basic choices.
-
AccountId: Required. Choose the monitoring accounts from which you wish to view data. The accounts shown in this drop-down menu are those to which you have access. You can choose single or multiple accounts.
-
Id: Required. Choose the monitors from which you wish to view data. The monitors shown in this drop-down list are contained in the account selected in the AccountId drop-down list. You must select at least one account in the AccountId field in order for the Id drop-down list to populate. You can choose any combination of the monitors available. For monitors with multiple steps (e.g., user journeys) you can select individual steps so that the query returns data for those steps only.
noteIf you have selected an account but the Id drop-down list presents no options, then it may be that an API query allowance has not been set for your company. To verify this, please exit the API and try to log in again, at which point you will be notified if your allowance has not been set. In this event please contact your Account Manager or Customer Support.
-
StartDate: Specify the start date for the test data you want to retrieve, either in yyyy-mm-dd format or using the date picker. If you don't specify a start date, the query defaults to the date 7 days ago.
-
EndDate: Specify the end date for the test data you want to retrieve, either in yyyy-mm-dd format or using the date picker. If you don't specify an end date, the query defaults to the current date.
-
LimitTestResults: Specify the maximum number of test results that you want to return. The default value is 20. Either use the default value or set it lower so that your queries run as quickly as possible.
-
Format: Specify the format of the returned data. Choose from XML, JSON, PHP, or YAML. XML is the default.
There are many more filters available to further narrow your results. The Query Builder UI text defines these filters.
Specifying Data Filters
Use the Return drop-down list to select the test data to return in the response. As with the test filter fields, smaller data sets reduce the size of the response and improve the performance of your query, so try to be as specific as you can.
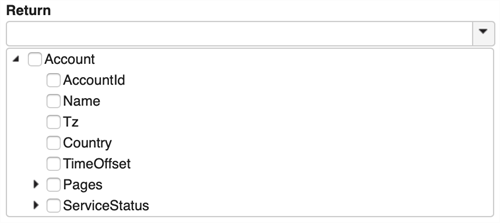
The Return filters drop-down list in the Eggplant Monitoring Query Builder
The drop-down list is a dynamically generated representation of the Eggplant Monitoring platform data structure. The data structure for the test results of page monitors is different from that of user journeys, so the tree looks different depending on the test filters you include in the query. Note that if you change the types of monitors in your query, the tree is re-generated, so items you selected might be lost. Also, certain branches of the tree display only if they contain data, so, for example, if you specify a date range for your query during which no tests were run, then the branches of the tree that relate to test result data do not appear.
The API is designed to give you access to the whole range of data on the monitoring platform, so the number of available data filters is extensive. A familiarity with the monitoring portal and the data available there can make data filter selection for an API query logical and intuitive. Nevertheless, there are a few key aspects of the tree structure that are worth highlighting:
- Under the main Account node are separate branches for monitors of different types, such as page monitors, user journeys, and web services monitors.
- For user journeys and web services monitors, the next level of the tree provides monitor-level information, i.e., the UserJourney node that falls under UserJourneys. Within this monitor-level node is a Steps node that holds the data for each individual page that is tested by the monitor. The structure of the Steps node is essentially identical to the structure of the Pages node, which contains data for single page monitors.
- At monitor level and page level, there are TestResults and TestingSummary nodes. TestResults contains information relating to specific tests, whereas TestingSummary can provide data averaged over standard periods, or just the data relating to the last test that ran. The summary data can be particularly useful, depending upon your business needs.
Reading the Query Response
After you construct your query, click the URL in the query string preview area to run your query. This opens a new tab or window, depending upon your browser, that displays the query results. You can click the URL at any point during the query compilation process and continually refine the query until the data returned is in line with your exact requirements.
Each query made results in a response that clearly defines if it was successful or not. The <Response> element (or its equivalent for non-XML formats) contains this information. If the query was successful, this element appears as follows:
<SiteConfidenceApi Version="current">
<Request/>
<Response Status="Ok" Code="200" Message="Success.">
</Response>
</SiteConfidenceApi>
Should the query fail, one of the following errors displays:
| Code | Message | Meaning | Solution |
|---|---|---|---|
| 101 (HTTP) | Service currently unavailable | The API is down or unreachable | Contact support |
| 301 (response) | Maximum number of items exceeded. Response was truncated. | You have requested too much data for the API to provide in one query | Narrow your query, or divide it into several queries |
| 401 (response) | Authentication failure | Your API key has expired | Log in again to generate a new key |
| 402 (response) | You have exceeded the maximum number of allowed requests. | The number of API queries made by your company has exceeded the contractual allowance, or the allowance has not been set | Contact support or your account manager |