Best Practices
This page describes the best practices to apply to your Eggplant Monitoring implementation. These best practices are intended to help increase the value you receive from your investment. Each best practice description should be configured to suit your specific needs.
Background
Each monitor within Eggplant Monitoring can be customized to meet specific client requirements such as target URL, network throttling, and viewport size to establish a comprehensive availability monitoring environment.
During each run of a monitor, a set of pre-defined tests are run against the loaded URL. These tests use preset default values to determine if a problem has been detected and whethere an event was issued. As each monitored environment is different, the default values are not set optimally, consequently, monitors may allow below unacceptable levels of availability and performance situations to go unnoticed preventing pro-active remedial action to be taken.
Use this topic as a reference for each of the available monitor settings that can be tuned to enable the implementation of website availability and performance policy, along with measurement criteria such as management reporting of service level agreements (SLAs). The following monitor settings are available:
- Frequency
- Download Speed
- User Agent String
- Screen Size
- Upload Speed
- Round Trip Time
- Connect Time
- Data Start Time
- Overall Threshold
- Search Phrase
- Page Size
- Speed KPI
Frequency
Frequency defines how often tests are run. The more frequent a test is processed, the more confidence you will have with the increased availability of the tested web asset as issues can be identified more quickly. Identifying what the web asset does for your business will determine how often you test. The time a test takes may also determine how often testing is conducted.
For example, a 9 step UJ for a retail company may take 3 minutes to complete, a single page load of the home page may take 10 seconds and an API less than a 100ms. Consequently, it is important to set frequency correctly to reflect the importance of the test being applied.
How to calibrate
Although frequent testing is always recommended, following best practices are worth considering:
- UJ: every 5 minutes
- Web page:every 5 minutes
- API or web service: every 1 minute
Note that the frequency of tests can only be set by Eggplant Support. It is set up at configuration time based on the monitoring contract. However, frequency can be modified, if required.
Download Speed
Setting the Download Speed is an important part of configuration and should not be changed without understanding the ramifications of the change.
The Download Speed setting is highly configurable and lets you enable network throttling so that the user experience for the slowest connected users can be monitored. It is flexible and allows monitoring of both slow and fast connecting users, and services.
Download speed would normally be set at initial implementation time based on the monitoring criteria defined at this time. Therefore, if multiple speeds are required for testing, such as that for a network-mobile and office-connected desktop environment, then multiple monitors would be established.
The stability of the Eggplant Monitoring architecture enables consistent benchmarks to be established and compared over time. Consequently, changing the download speed will have an impact on historical comparison.
How to calibrate
Download speed is mandatory when the monitor is set up, therefore a value will be applied. Contact Eggplant Support to modify this value for you, but care should be taken when recalibrating this setting. This setting should also be considered in conjunction with Upload Speed and Round Trip Time (RTT).
User Agent String
The User Agent string identifies the user agent associated with a monitor. The User Agent is a reference to a specific device or browser combination, which may be used by the server to interpret the User Agent string and apply specific criteria for the string provided.
Therefore, it can be used to aid emulation capability of the monitor. For example, the User Agent String presented by Safari browser on an iPhone X is different to that of a Samsung UC browser on a Samsung Galaxy 9+ or Firefox on a desktop. Consequently, when defining the monitor settings, the correct UA String should be selected.
How to calibrate
The User Agent string is not mandatory at set up time. A typical User Agent string has the following format:
- Mozilla/x.x (X11; Linux x86_64) AppleWebKit/XXX.XX (KHTML, like Gecko) Chrome/XX.X.XXXX.XXX Safari/XXX.XX Eggplant/XX.XX.XX
Where XX represents the required version number.
Note that the above settings may not be suitable for a monitor applied to a mobile environment. With administrator privileges, the User Agent String can be set in the monitor settings.
Screen Size
Improved emulation can be applied through the use of the Screen Size settings. Both screen width and height can be applied to enable the viewport to be set correctly for the device configuration that is being monitored.
The default screen size is 1680x1050, but the viewport of current devices can range significantly. Setting the viewport is important as it defines what content is rendered to the screen. This will be different on a smartphone to that of a laptop.
How to calibrate
Screen size is not mandatory at setup time, therefore it may still have the defaults applied. It is recommended to determine what device needs to be monitored and obtain the correct viewport dimensions, and then apply them to the monitor.
This setting is non-editable and only an Eggplant Support representative can modify it for you.
Upload Speed
Upload Speed complements the download speed setting and sets the upload speed of the network connection. The faster the upload speed, the smoother the online experience will be. Therefore, it is not recommended to test with the Upload Speed value set to high.
Both download and upload speed are highly variable for real users as they depend on the network conditions at the time and the settings of the connecting ISPs.
Download and upload speed should be set to complement each other. A typical 3G connection might be set up as (Download/Upload) 1920 Kbps / 600 Kbps and a Desktop connection set at 5 Mbps / 1 Mbps. The download speeds may appear slow, but as websites rarely stream data, they don't benefit from larger bandwidths unless latency is reduced. Therefore, testing at this setting is sufficient for synthetic testing.
How to calibrate
Upload speed is not mandatory at setup may not have been set by default. Contact Eggplant Support to apply this setting for you, but as with download speed care should be taken when recalibrating this setting. This setting should also be considered in conjunction with Download Speed and Round Trip Time (RTT).
Round Trip Time
Round trip time or RTT is also known as latency. This is the inherent network delay that occurs between the network and server. Minimum specifications for RTT are recognised and should be considered as the default monitor settings.
RTT has a great impact on the overall effectiveness of network connectivity, website availability, and performance. Therefore, it is important to apply this setting to ensure that RTT is accounted for in your monitoring.
How to calibrate
RTT is not mandatory at setup time. To set network latency in accordance with the policy requirements required for each monitor, the following settings are recommended:
- 3G: 200ms
- 4G: 55ms
- Desktop connection: 10ms
Contact Eggplant Support to apply this setting for you. As with download and upload speed, care should be taken when recalibrating this setting.
Connect Time
Set at the page level, the Connect Time threshold setting is used to check the duration of the connect time process. Connect time is the measured time it takes to establish a TCP connection between the server and the client. Typically, this is a very fast process and should take only milliseconds, often below 10ms.
By default, this is set to 30 seconds. This default setting effectively turns off the monitor test, resulting in connection issues going unreported, which may cause delay in taking preventative actions.
How to calibrate
The recommended setting for Connect Time is 1 second, which is the minimum value that can be applied and also many multiples of the value being tested. If connection times occur above 1 second, they should be investigated through triage processes.
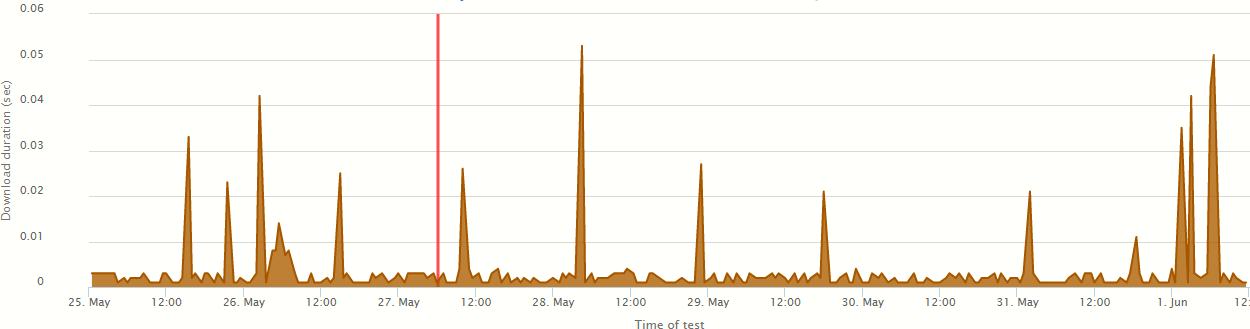
Connect time duration
In the above chart, connection time is shown to normally complete within 5ms, but across the 5-day period it has regularly spiked to 25ms and ocasionally even higher. In a busy system, this may be an indicator of potential issues. Therefore, setting this value at 1 second will bring attention to issues if they occur.
Data Start Time
Set at the page level, the Data Start Time threshold setting is used for checking the time to first byte. The time to first byte is the time from an initial request for the web page to the time the first byte of the HTML stream is received by the requesting client. This time is taken from the Navigation API and the best practices are dependent on several factors such as network speed, RTT, and the time taken to generate the HTML stream on the server. Following are the recommended settings for Data Start Time over various connections:
- 3G: over 500ms
- Connected broadband and 4G: under 250ms
The default setting of 0 seconds turns off the monitor test, which indicates that slowing down of data start time may go undetected, resulting in page loads taking longer.
How to calibrate
The recommended setting for Data Start Time is 2 seconds. Although a more aggressive time could be set (1 second), this may generate unnecessary alerts. At 2 seconds, a 3G connection is four times slower than the best practice recommendation and may imply an inherent issue if the alert was persistent.
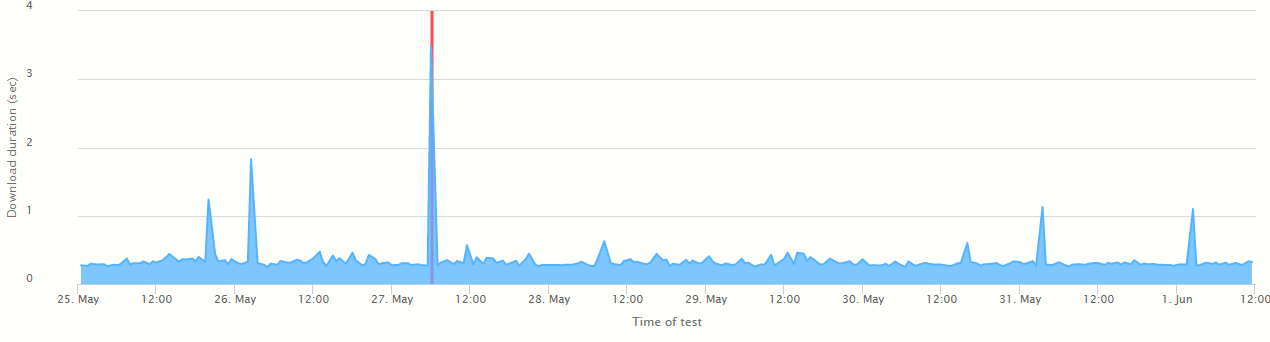
Data Start Time
On web pages tested at network speeds of 4G and above, you could set this to 1 second. This is because only slow websites consistently deliver a data start time over 200ms.
Overall Threshold
Set at the page level, Overall Threshold is the default setting that governs how long the monitor should run for. If the monitor takes longer than the time set in the Overall threshold, then it will stop monitoring the loading process and report the status of the page load at that point in time.
By default, this value is set to 30 seconds. When response times are expected to be within a few seconds, this threshold represents a very long time and as such could allow other issues to go unnoticed.
How to calibrate
Review the average value that the webpage takes to download and set Overall Threshold to 3 seconds above that.
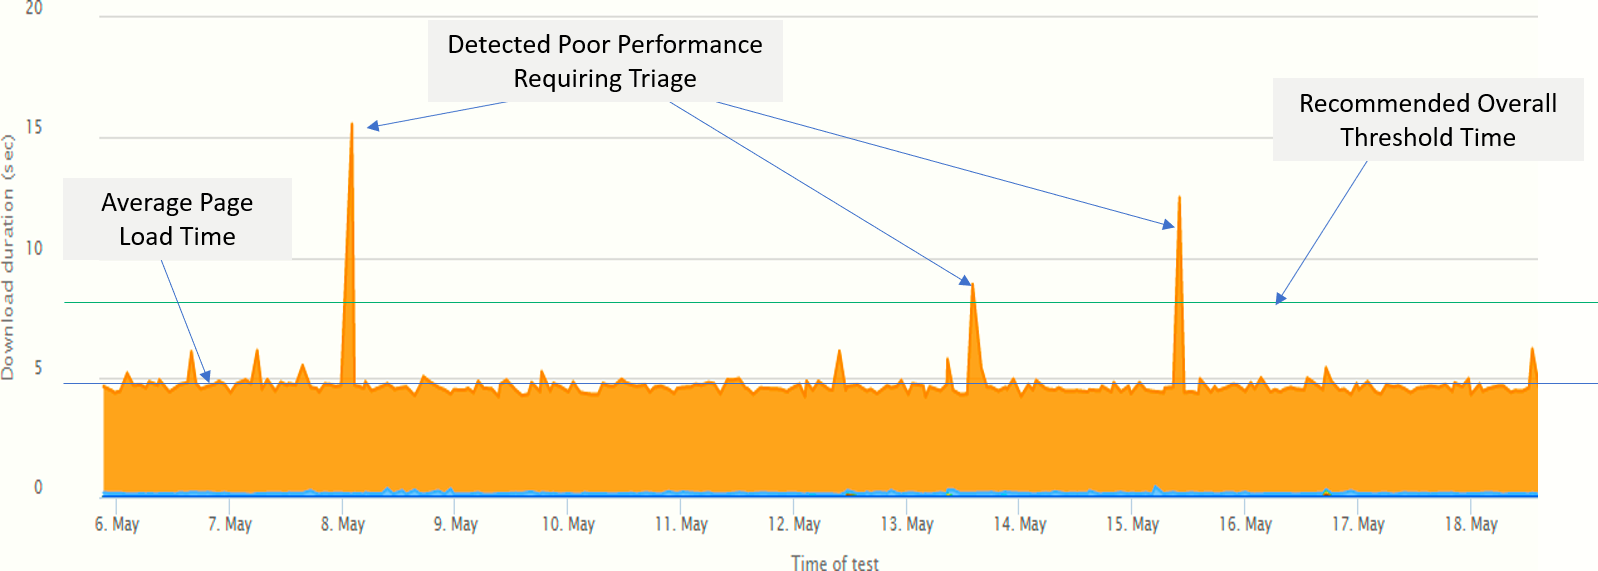
Set the Overall Threshold based on the average page load time
The above example shows that the average download duration for the webpage is about 5 seconds. Therefore, the Overall Threshold should be set to 8 seconds. Over the period shown, three events occurred that should be triaged to determine if an underlying, or developing issue exists. With the default setting still in place, these potential availability and performance issues would have gone unnoticed.
Search Phrase
Important: Do not adjust this setting. Contact Eggplant Support to discuss any changes you may require.
Set at the page level, the Search Phrase setting is used to check that one or more specific phrases are loaded onto the web page. This is a useful test approach to ensure that specific elements of the web page have loaded as expected.
If the phrase does not load within the Overall Threshold time, then a problem event is raised with the return code: 23 Expected Phrase Not Found.
How to calibrate
Contact Eggplant Support to get this check applied. Alternatively, if you have administrator rights, you can manage phases through Monitor Settings in the Administration Portal.

The Search Phrase setting
You can also check for multiple phrases and run enhanced checks by applying a range of filters to the search logic.
Page Size
It is a well-known fact that page size can affect the download time of a webpage, therefore on websites that regularly change content, this check can quickly pick up invalid changes, e.g., over-sized images. In addition, the check is also useful to ensure that all resources are loaded on the webpage that change infrequently.
Both minimum and maximum sizes can be tested for reasonable fluctuations that are known to occur on webpages.
How to calibrate
Page size is not mandatory at set up time and the defaults are set so that testing does not occur. The settings can be applied through Monitor Settings in the Administration Portal or contact Eggplant Support for more help.
Care should be taken when applying these settings as some of these are sensitive and may trigger unnecessary alerts.
Speed KPI
The Speed KPI does not apply a test or alert if a test fails. However, it does allow you to view its performance policy on the performance charts.
This setting is calibrated in seconds and will enable a KPI line to be drawn across the performance chart. This helps with quickly identifying tests that are slower than the desired performance objective.
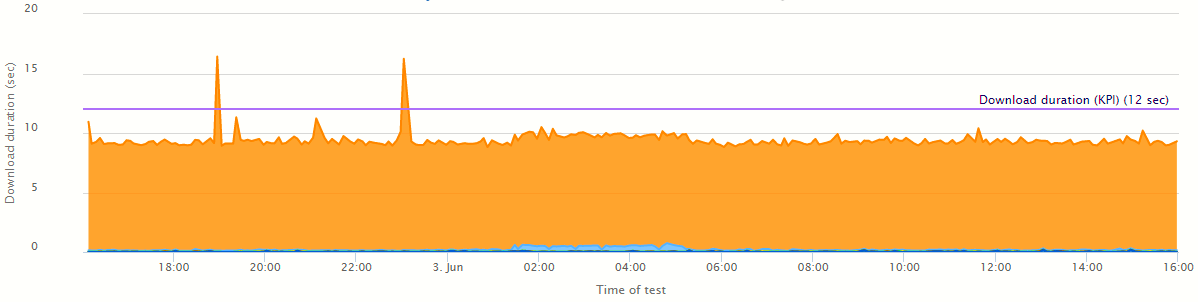
The Speed KPI line drawn across a performance chart
The above example shows the KPI set at 12s and when the policy was breached.
How to calibrate
Speed KPI is not mandatory. It is a read-only setting only.

The Thresholds settings showing the Speed KPI optionally set to 9 seconds
These settings can be applied through the Monitor Settings in the Administration Portal. Alternatively, contact Eggplant Support to get these settings applied for you.