Glossary of Terms
This section provides a list of timing points used in the Performance Breakdown report in Eggplant Monitoring:
Standard Timings
DNS
The number of seconds spent resolving a host name into an IP address.
Connect
The number of seconds required to create a TCP connection to the web server (this does not includes SSL).
SSL
The number of seconds spent performing SSL handshake for encrypted HTTPS requests
Request Sent
The time immediately after the user agent receives the first byte of the response from the server, or from relevant application caches or from local resources.
Data Start
Time To First Byte for the very first request.
Performance Timings
CPU Time
Indicates the time taken (in seconds) for a single CPU core to complete execution of the step or monitor, assuming 100% utilization.
Script Duration
Indicates the total time taken (in seconds) for completing execution of all Java scripts on that page or step for this particular test.
First Paint
Indicates the point at which the first pixel renders on the screen after you navigate to the web page.
Largest Contentful Paint (LCP)
Marks the point in the page load timeline after the page's largest visible content element has loaded.
Interaction to Next Paint (INP)
Measures the delay between a click, tap, or keystroke, and the moment the browser paints the resulting visual change.
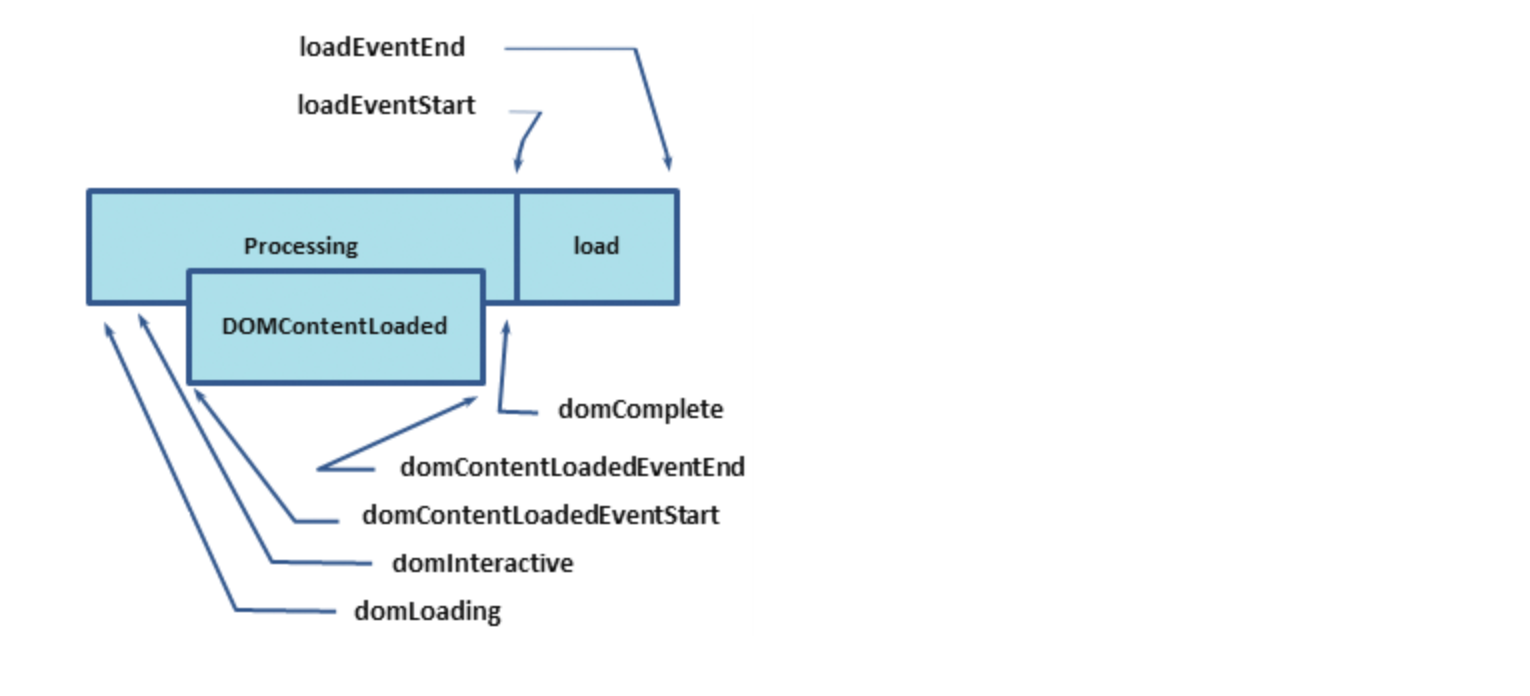
DOM Content Loaded
Marks the point (or time taken) when the DOM is ready as well as no stylesheets are blocking JavaScript execution.
DOM Complete
Marks the point in time when all the processing is complete and all the resources on the page or monitor (images, etc.) have downloaded.

Shows DOMContent Loaded information
Cumulative Layout Shift (CLS)
Measures the sum of all individual layout shift scores for every unexpected layout shift that occurs during the entire lifespan of the page. To provide a good user experience, sites should strive to have a CLS score of less than 0.1.