Managing Tests in Eggplant Performance
Tests consist of one or more Virtual User Groups that execute your scripts via one or more virtual users (VUs). If you use the Objectives feature, you can work step-by-step through the process of creating the elements necessary for a test. You can also create these elements directly through the Workspace and Project trees, then use the Test Builder wizard from the Project tree to complete the test creating process.
Test Builder
To create a test with the Test Builder in Eggplant Performance Studio, right-click the Tests folder (or a custom folder beneath Tests) in the Project tree, then select New test to open the Test Builder wizard.
Test Builder Wizard
The Test Builder wizard guides you through the creation of an Eggplant Performance test, using either groups of virtual users running Eggplant Performance scripts, or JMeter thread groups running JMeter test plans.
Test Description
- Name: Enter a name for the test.
- Description: (Optional) Enter a description for the test.
After you click Next, the New Deployment Item dialog box opens.
New Deployment Item
Select one of the following:
- VU Group Name: Make this selection to begin creating an executable Eggplant Performance test. The Group Name you enter is used to identify this group of virtual users in the test configuration and test results later. Click OK to open the Group Specification dialog box.
- JMeter Test Plan: Making this selection lets you choose from the available JMeter test plans that were imported into Eggplant Performance. After you select a JMeter test plan and click OK and the JMeter Specification form opens.
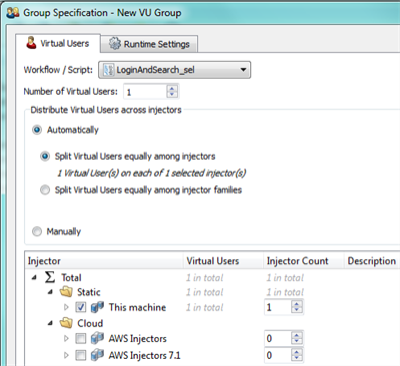
Group Specification

- Make changes to the selections shown in the Group Specification dialog box, then click OK.
See Configuring Virtual Users and Configuring Runtime Settings for more information about the configuration changes you can make using this dialog box.
- Click Finish to finish configuring this test.
See Manage Virtual User Groups to make additional changes to this test.
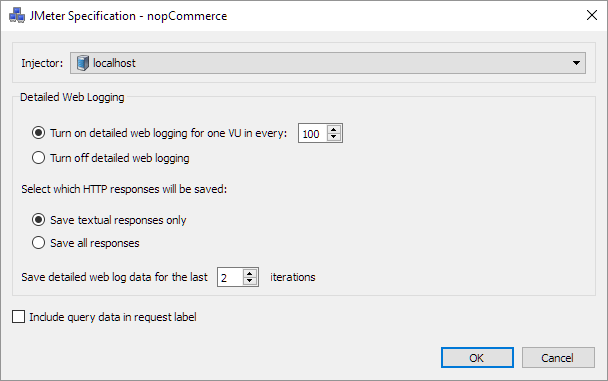
JMeter Specification

Modify the JMeter specifications for your test using the following information:
- Detailed Web Logging: These settings enable and configure the storing of web logs for viewing after a test run. You can limit detailed web logging to conserve system resource. For instance, you can reduce the default value of one VU in every: 100 shown in the above dialog box to a smaller value for more detailed logging
- Select which HTTP responses will be saved: These settings let you configure the test to save all HTTP responses, or to limit the HTTP responses to text responses only.
- Save detailed web log data for the last...: This setting lets you adjust the number of test iterations to save the detailed web log data for this test. Adjust this number depending on the system resources you have available.
- Include query data in the request label: Each HTTP request that is timed has to be identified by a label. If you select this checkbox, the label identifying the timing is the full URL, including query data. The query data is the part of a URL following the
?symbol. If you clear this checkbox, the label excludes the query data from within the URL. Clearing this checkbox results in fewer timing labels as many requests share a common URL that exclude query data.
After you finish making your selections, click OK and the Test Builder Properties dialog box opens. Click Finish, and the Test View panel opens.
Extra Configuration in the Test Builder Wizard,
Once you add the first VU group or JMeter test plan to the test, it is possible to change its configuration or add more VU groups or JMeter test plans before you click Finish. These options are available as toolbar buttons or by right-clicking the table of VU groups/JMeter test plans.
-
Add VU Group: This option brings up the Group Specification dialog box. See VU Group Settings for more information.
-
Delete VU Group: This option removes an existing VU group.
-
Edit VU Group: This option brings up the Group Specification dialog box of an existing VU group:

-
Copy VU Group: This option lets you copy an existing VU group into any test in the current project. Once a VU group has been added to the test, it is displayed in the table of VU groups. This table contains two checkboxes.
-
Group: This option lets you include (selected) or exclude (cleared) the selected VU group from the test.
-
Runtime Settings: This option lets you manage the Iterations, Ramp-up, Pauses, Event Logging, Web: Logging, and Web:Options settings for a VU group that is being added to a test.
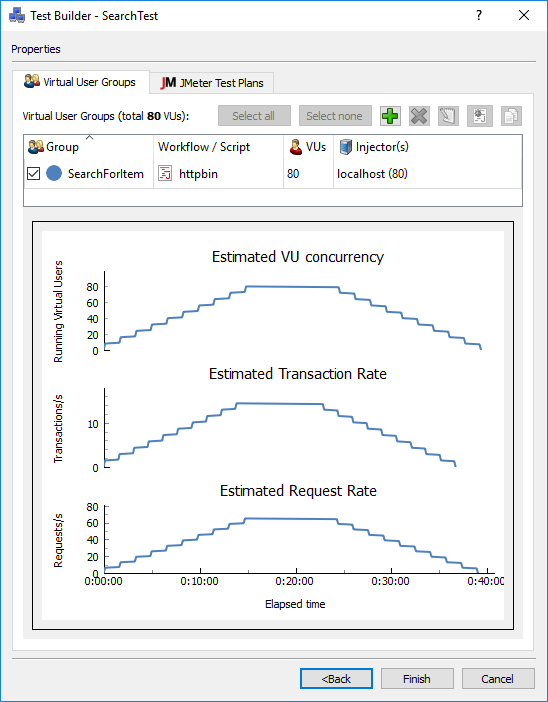
After a VU group has been added to the test, the Test Builder wizard displays the group as it has been added, along with a chart of the ramp-up time:

- Click Finish and the Test View panel opens.
Test View
The Test View pane has several tabs.
- Virtual User Groups: View and add VU groups for the test.
- JMeter Test Plans: JMeter is a software application that you can connect to Eggplant Performance and use as a load testing tool. See Managing JMeter Test Plans for more information.
- Data: View the data bindings for the selected test. See Assigning Data Sources to Eggplant Performance Tests.
- Monitoring: View and select which monitors to run during the test. See Adding Monitoring Profiles to a Test.
- Cloud: Choose a behavior for any cloud injectors that run the test.
- Eggplant Functional: Choose whether or not to stop all Eggplant Functional instances at the end of the test run. See Launching Eggplant Functional from Eggplant Performance.
- KPIs: Select a KPI to associate with the test. See KPIs in Eggplant Performance Studio.
- Shared Data Server: Select this option if you want Eggplant Performance to start the Shared Data Server (SDS) at the beginning of the test. The SDS service provides a common data store that is accessible by virtual users (VUs). Selecting this option is helpful, as it ensures that the SDS service starts before a test runs, helping you avoid connection errors. See Shared Data Server for more information.
Automatic Test Creation��
Tests can also be created by right-clicking a script or workflow and selecting Create Test. A new test appears under the Test folder with the same name as the selected script or workflow. The test contains a single Virtual User Group configured to run one VU for a single iteration. This test can then be modified.
Deleting a Test
To delete a test, select the test, then right-click it and select Delete from the context menu.
Cloning a Test
To clone a test, right-click it and select Clone. Enter a New Test Name into the window that appears.
Starting a Test
After a test has been created, launch Test Controller by clicking the Open Test in Test Controller button.
Then in Test Controller, you can start the test run by clicking the Start Test button.