Eggplant Performance Analyzer Data Tables
Although Eggplant Performance Analyzer charts provide a quick, visual representation of your data, you will probably need to view your data in table form as well for specific analysis. You can view the table data for any chart by using the Show table view button in the Analyzer toolbar when the chart is selected in the Project tree.
Viewing Chart Data as a Table
By default, table data is sorted on the row header. However, you can sort by any column by clicking the column heading so that you can sort to the top or bottom whatever data you find most relevant. You can turn off table sorting by using the Enable table sorting toggle button on the Analyzer toolbar.
Your sort choices are saved so that they persist between views of a given table. To remove sorting from a table, use the Enable table sorting toggle to turn off table sorting, which returns the table to being sorted by the row header.
The Series sidebar is active on the table view just as on the chart view. That is, you can use the Series sidebar to add or remove data points from the currently displayed table. Anything you add to a table is added at its appropriate place in the current sort order and will update accordingly if you re-sort the table just as you would expect.
Note that you can export table data as a .csv file for additional analysis or use in other applications. To do so, use the Export as csv button on the Analyzer toolbar or right-click the table and select Export as csv.
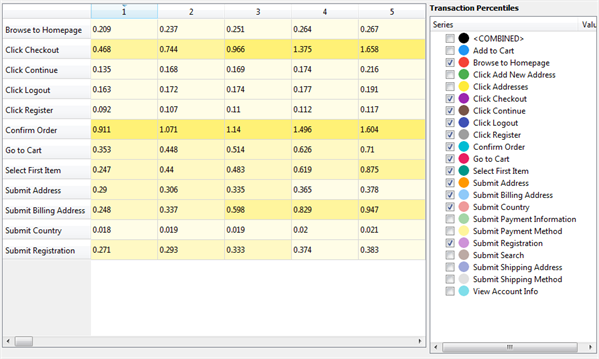 Table view of analysis data displaying the heat map
Viewing the Table Heat Map
The table heat map feature displays a "heat map" of your data within the table view; that is, the most relevant data (generally, the poorest performing) will be brightly colored to highlight it, and other statistics are less bright.
When you view a table initially, the heat map feature is on. You can toggle this feature on or off by using the Show table heat map button on the Analyzer toolbar. If you turn this feature off, the table displays with no color.