Bug Hunting
The Bug Hunting report is split into two sections to give you an overview and more detailed analysis of where failures happened in a model without opening test log files.
History Chart
On the History chart, view at-a-glance success metrics for actions and tags.
The Actions and tags table shows how many discrete actions have failed. In the first example shown below, 14 failures occurred across six actions.
The bar chart shows data for either Actions or Tags.
-
By default, the success metrics for each action with at least one reported failure are displayed.
-
To switch to the success metrics for tags that are defined for your model, simply click Toggle to Tags View.
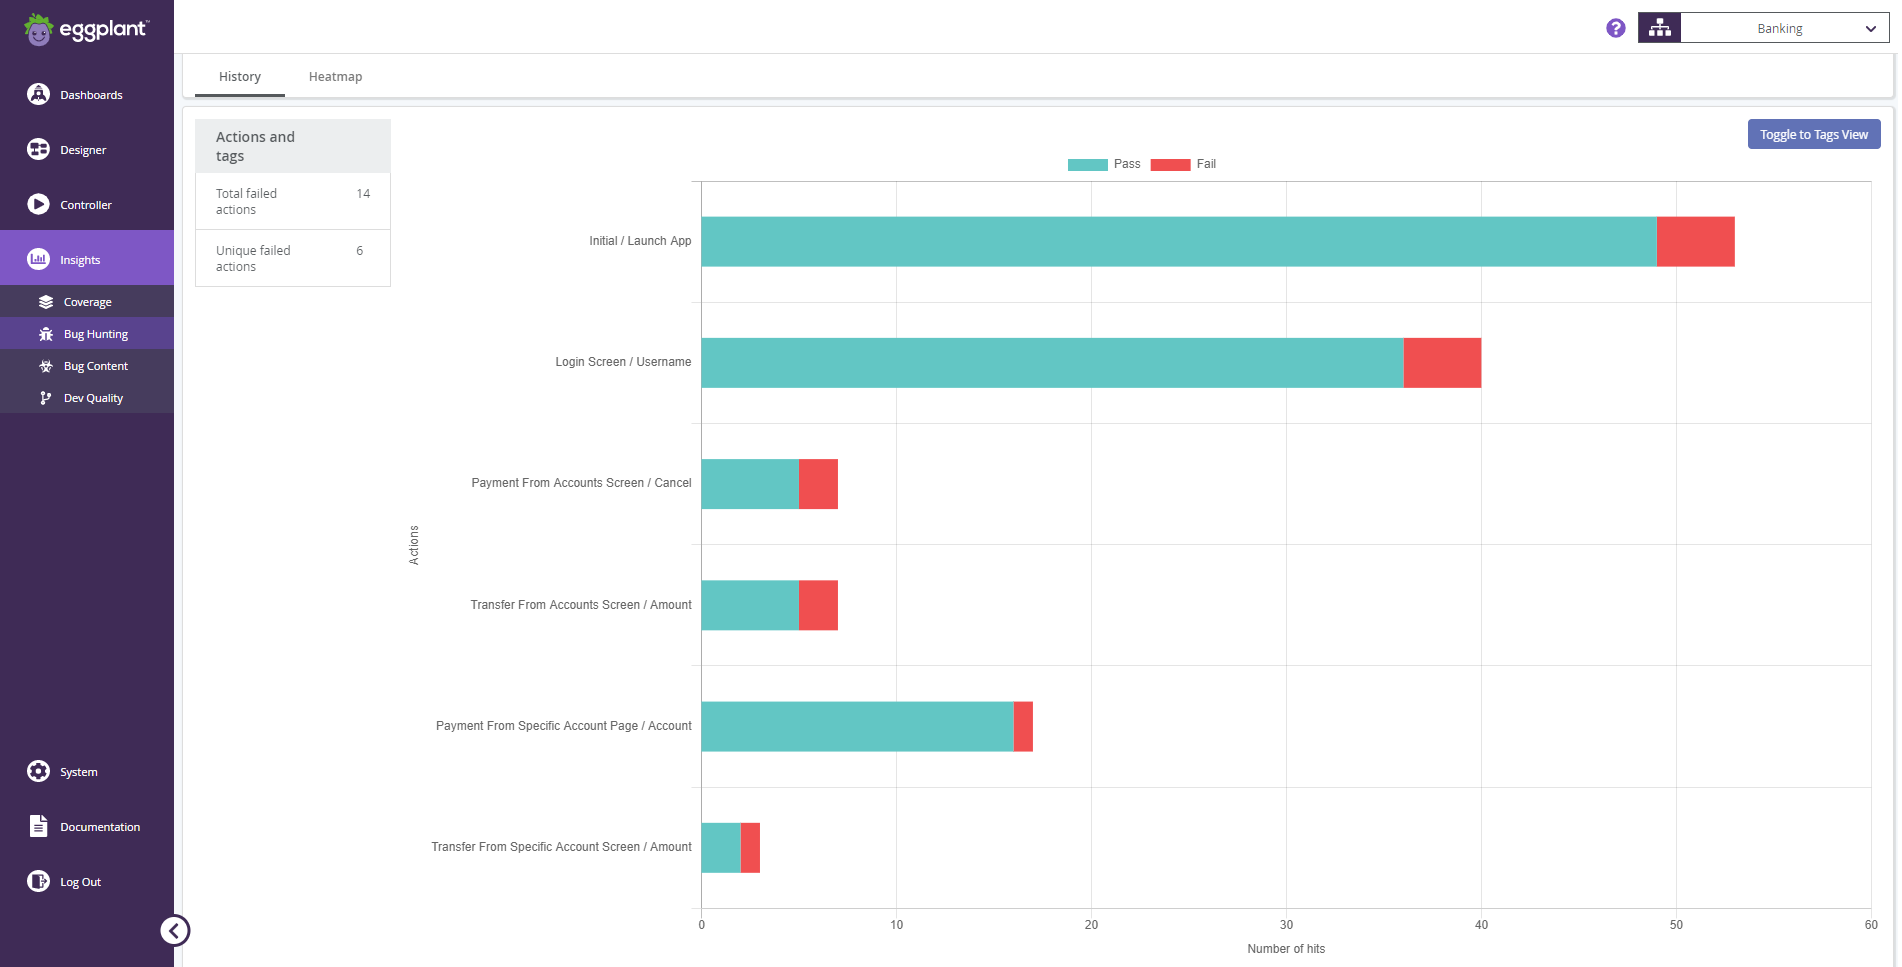
Bug Hunting report in Actions context
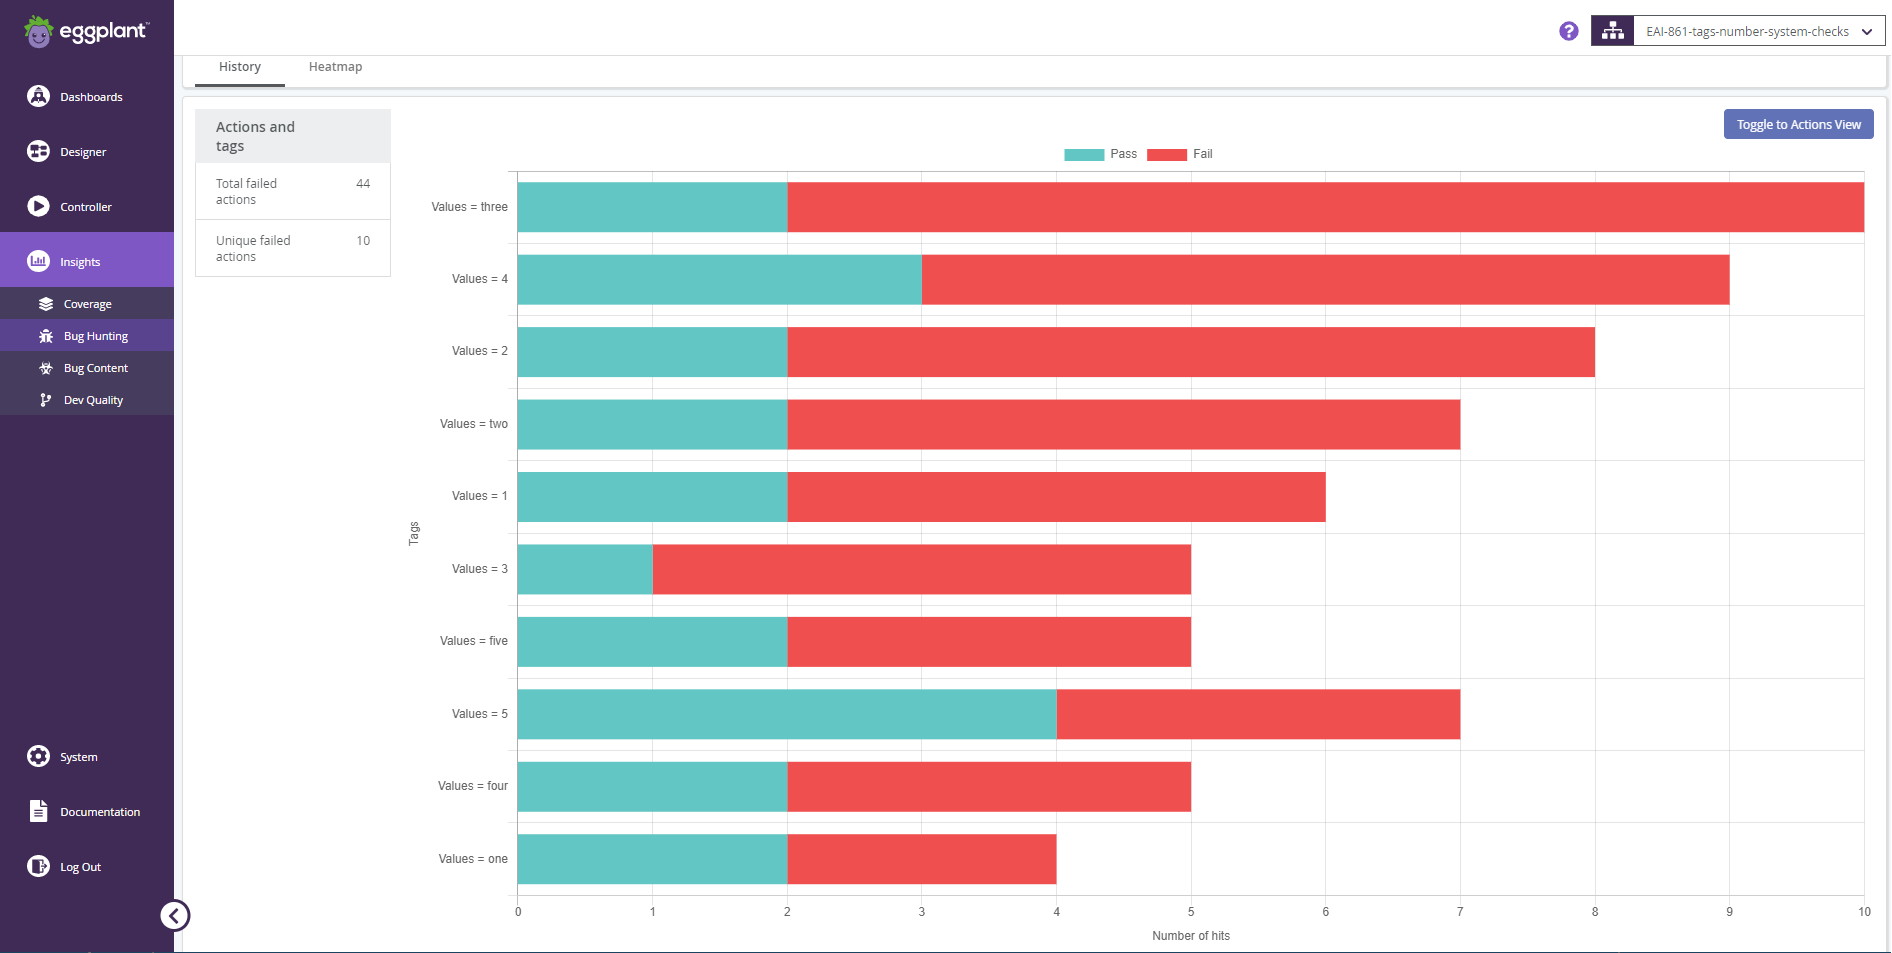
The Bug Hunting report in Tags context
Heatmap
On the Heatmap, the failure rates of actions within the selected model are represented by their background color.
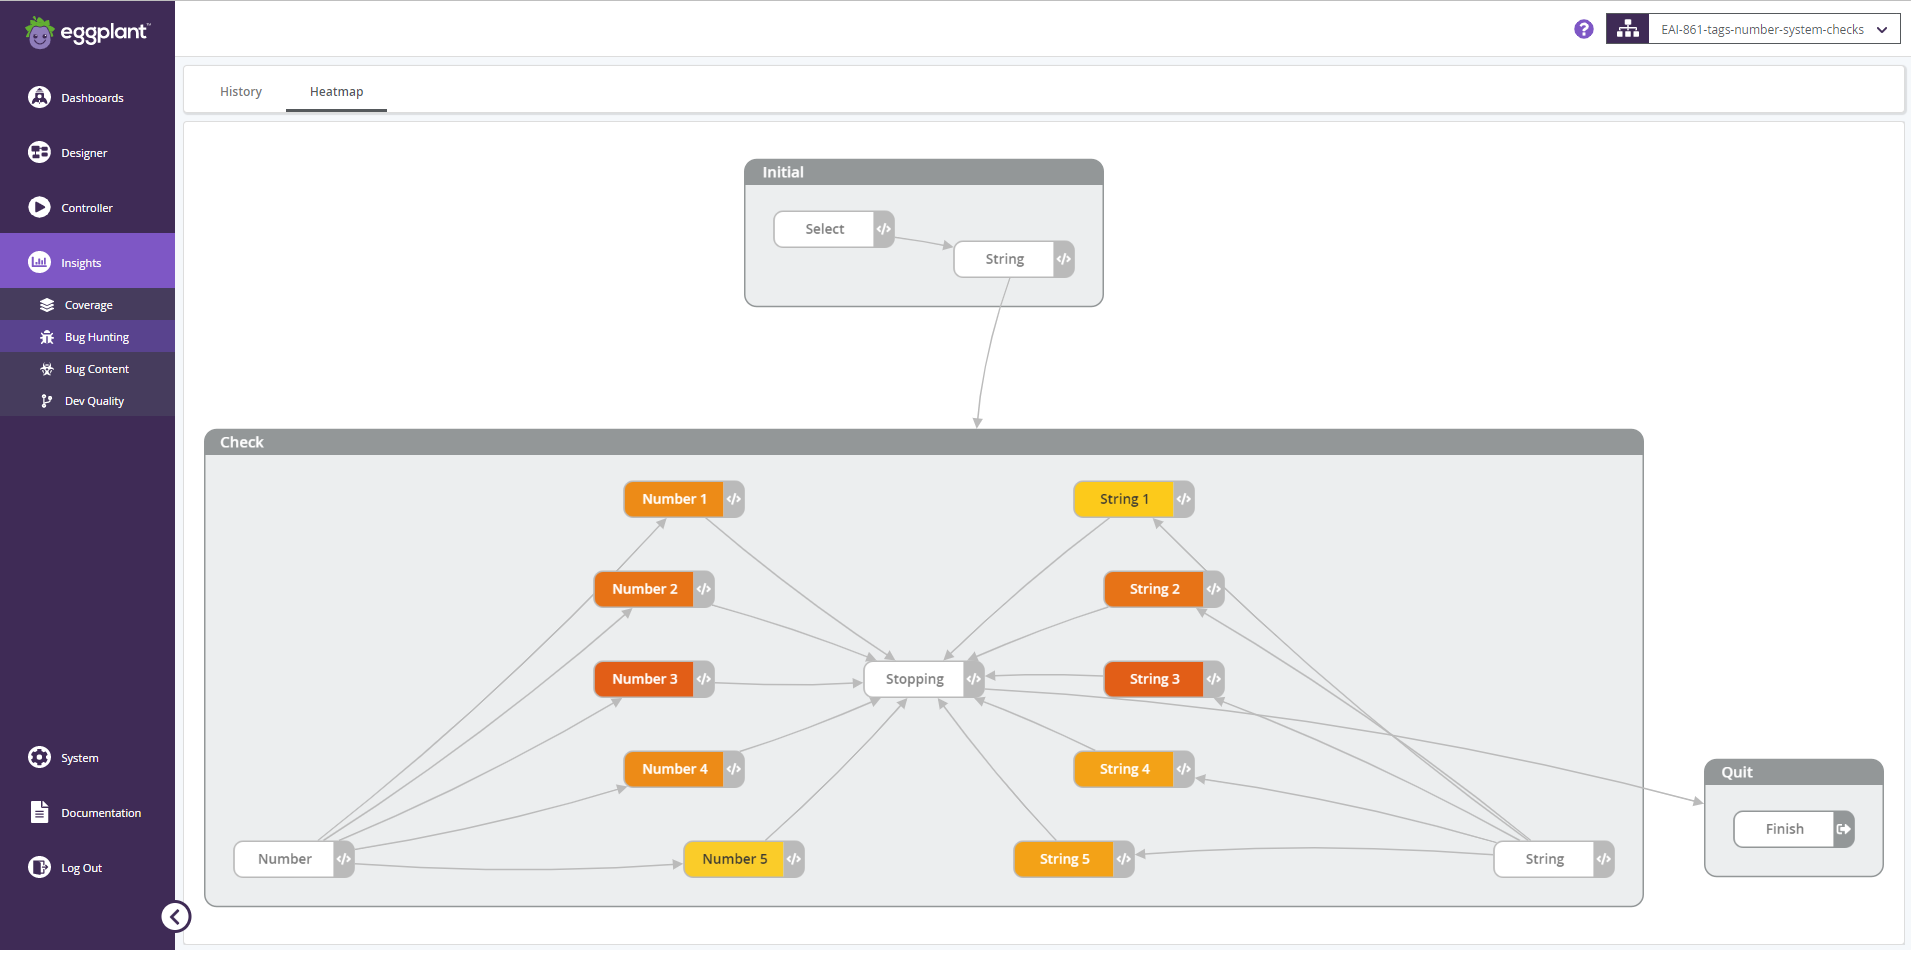
The Bug Hunting Heatmap
The intensity of the action color gives an indication of the failure rate. For example:
- A white background means no failures have been recorded.
- A yellow or orange background means that more than one failure has been recorded.
- A red background means that no passes have been recorded.
The Heatmap only shows actions with colors if at least one action in the model fails during a test run.
The Bug Hunting heatmap visualizes the failure rate of actions within a model. Any action with more failures than passes has a colored background. For example, an action with only failures and no passes will show a deep red color. The intensity of this red color will decrease if the action is triggered successfully.
-
To view the Bug Hunting heatmap, go to Insights > Bug Hunting and click Heatmap.
-
Select a model. The Bug Hunting heatmap appears displaying the failure data.
The color of the failed action color coding varies depending on its failure ratio:
| Failure Ratio | Background |
|---|---|
| No failure | |
| One failure | |
| Always Failing |
The heatmap only shows actions with colors if at least one action in the model fails during a test run. The text color of the action will change for readability; it does not represent any specific data.