Coverage
The Coverage report is split into two sections to give you an overview and more detailed analysis of test coverage against the latest version of the selected model.
History Chart
On the History chart, view at-a-glance success metrics and the coverage percentages against the number of runs for the default coverage types:
- All nodes
- All pairs
- Extended
- Full exploratory
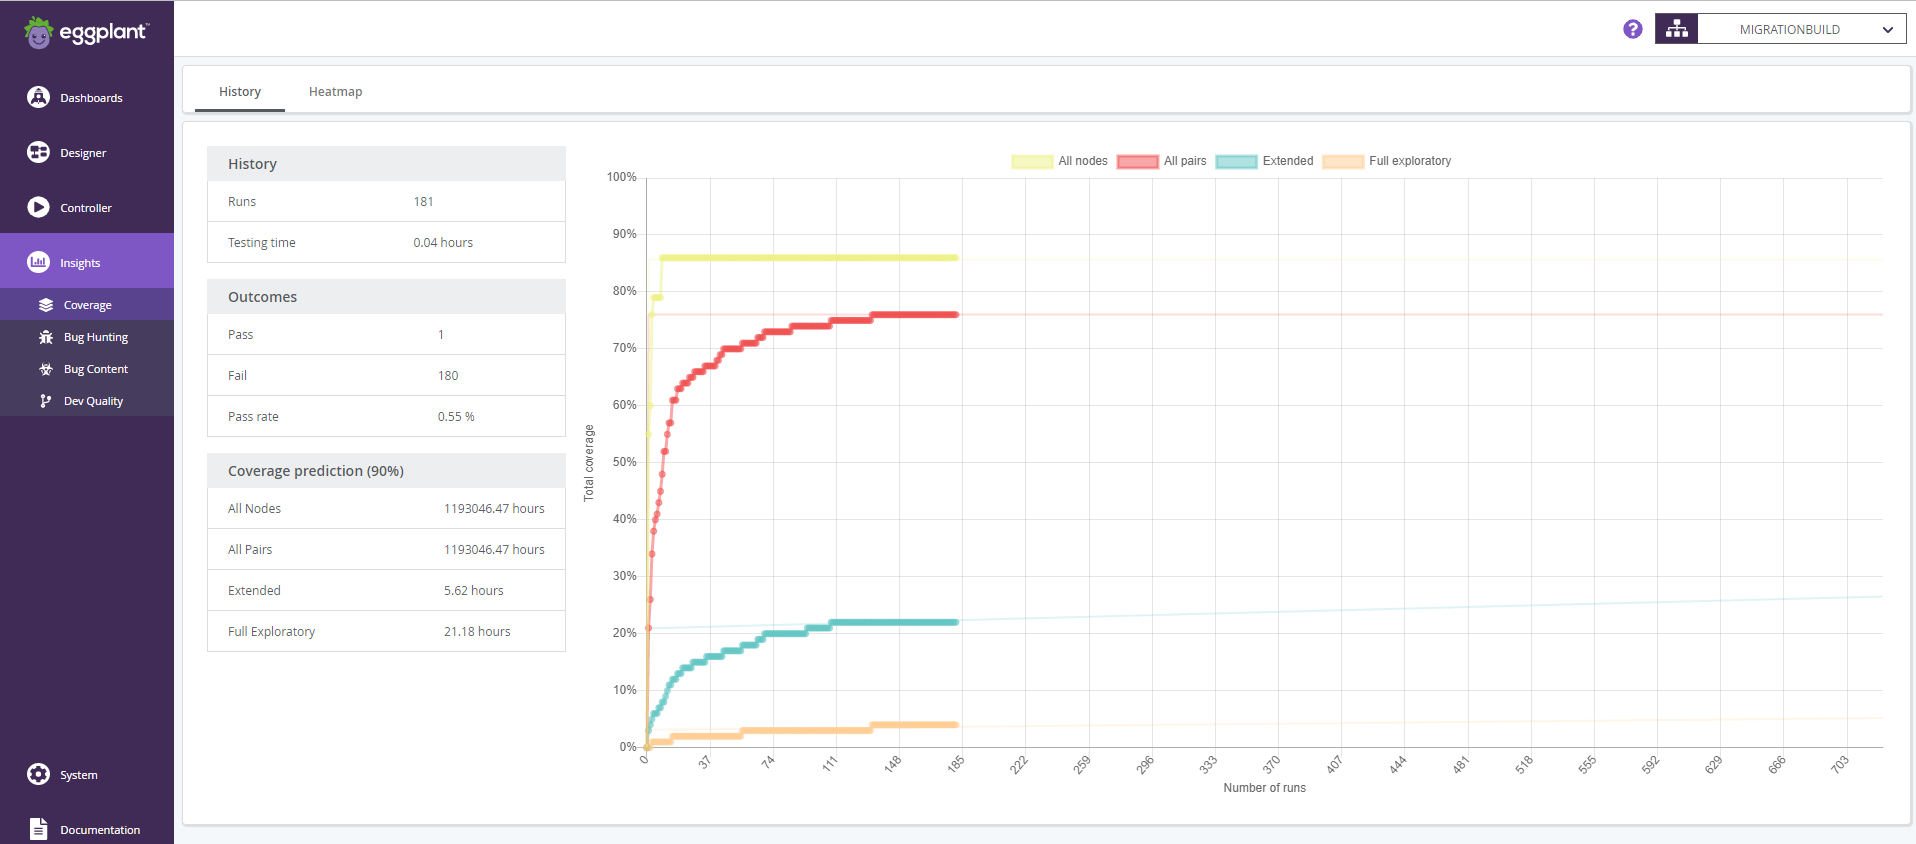
The Coverage report in Insights
The following data is displayed:
History
-
Runs: The number of completed test runs for the selected version of the current model.
-
Testing time: The total duration of all test runs.
Outcomes
-
Pass: The number of passed test runs.
-
Fail: The number of failed test runs.
-
Pass rate: The percentage of test runs that have passed.
Coverage prediction (90%)
This is an estimate of how long it will take to reach 90% coverage for each coverage model, based on the actual results plotted in the graph. If 90% coverage has been achieved, this field says Done; otherwise, the number of hours remaining until 90% coverage is listed for each coverage type.
Heatmap
On the Heatmap, drill down into detailed coverage metrics for each coverage type, including states, actions, and paths.
![The coverage Heatmap in Insights]](/dai/assets/images/dai-coverage-heatmap-42517a1696ab83e190a2212c24540bc0.png)
The coverage Heatmap in Insights
The Coverage Heatmap visualizes the coverage percentages of states and actions within a model.
To view the Coverage Heatmap, go to Insights > Coverage and then choose Heatmap in the sub nav. You can change the current model by using the model dropdown selector above the heatmap.
Custom coverage models cannot be rendered in this view.
Coverage Summary
Changing the Coverage Model dropdown in the sidebar will update the visualization and sidebar content. The following options are available:
-
All Nodes
-
All Pairs
-
Extended
-
Full exploratory
The following metrics are displayed in the sidebar for each coverage type:
-
Total coverage percentage
-
Number of states covered
-
Number of actions covered
-
Number of paths covered
Model Visualisation
Elements of the selected model without coverage are rendered in grayscale. Actions and states with coverage show backgrounds that are saturated relative to their coverage percent, increasing from light blue and to dark blue. The font color of these percent values will change only for readability; the font color does not have additional meaning.
The cumulative coverage of actions, state parameters, and submodels within a state shows as a percentage in the state header. The global action container will not show a coverage percentage.
Element Coverage
Clicking a state or action within the model will update the sidebar with metrics specific to the selected element.
Metrics
When an Action is selected the following is displayed under a Action Summary section:
-
The name of the action
-
The name of the state containing the action
-
Coverage percent of the action
-
Hit count
When a State is selected the following is displayed under a State Summary section:
-
The name of the state
-
Coverage percent of the state
-
Hit count
Hit count is the cumulative number of times that the element was hit during all previous test runs.
Paths
The possible paths through the model that includes the selected element are listed. Depending on the coverage report some of these paths will either be listed under a section named Covered Paths or Uncovered Paths.