Running an Eggplant Performance Test
The second part of our Eggplant Performance quick start guide:
- Provides step-by-step instructions for running a test in Eggplant Performance broken down into tasks
- Focuses on the functionality of Eggplant Performance Test Controller.
After you configure the parameters of your test and successfully build your project in Eggplant Performance Studio, you can:
- Execute your test in Test Controller
- View the behavior of the virtual users (VUs) in real-time.
Opening the Test Controller
The first task you need to complete is to open the Test Controller. Either:
- In Eggplant Performance Studio, right-click your test and select Open test in Test Controller from the menu. The separate Eggplant Performance Test Controller application opens.
- From Eggplant Performance Studio toolbar, click Test Controller. This method opens Test Controller with the last test you had open. You can switch tests, as well as workspace or project, by selecting File > Switch current workspace/project/test.
For more information about Test Controller, see Getting Started with Eggplant Performance Test Controller.
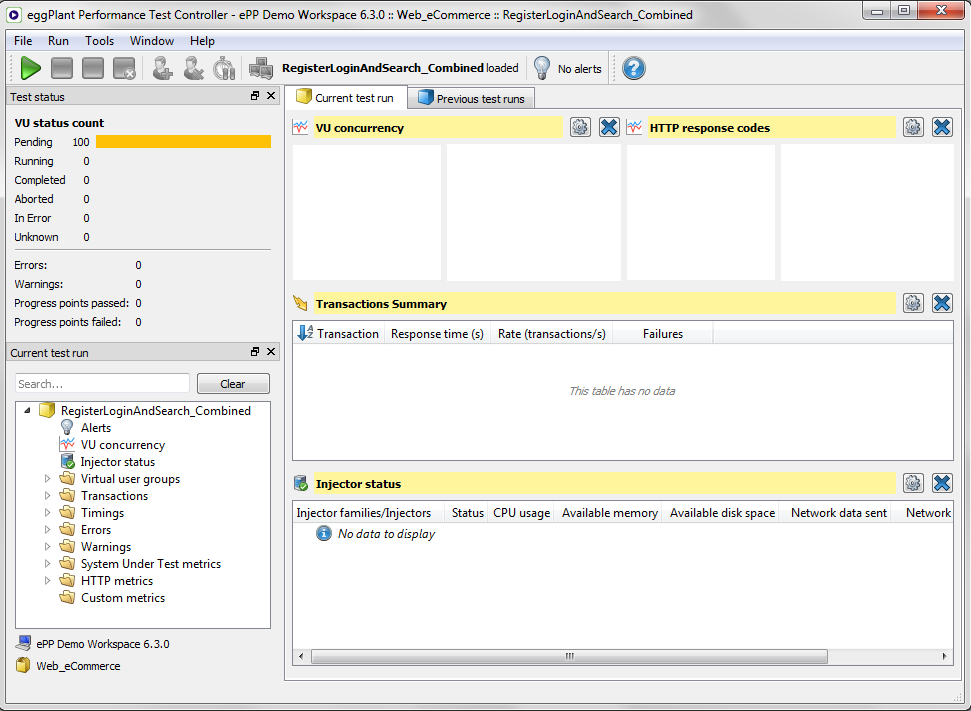
Setting Up Charts for Viewing During the Test Run
Set up charts in Test Controller to see the information that you want during your test run. When you first open a test, Test Controller shows several charts in the main part of the window. However, you might want to add other charts or tables, or rearrange how they are displayed.
All of the charts and metrics available for the current test are in the left sidebar, in the Current test run section. Navigate in the tree to the metrics you want to see, then double-click to open them in the main window. You can also right-click for additional options.
You can drag to reposition individual charts, as well as resize them for better visual display. You can make changes to the charts displayed at any time:
- Before you start the test
- While the test is running
- After the test completes.
For additional information about viewing test metrics in Test Controller, see Real-Time Test Monitoring in Test Controller.
Running Your Test
When you are ready to begin your test run:
-
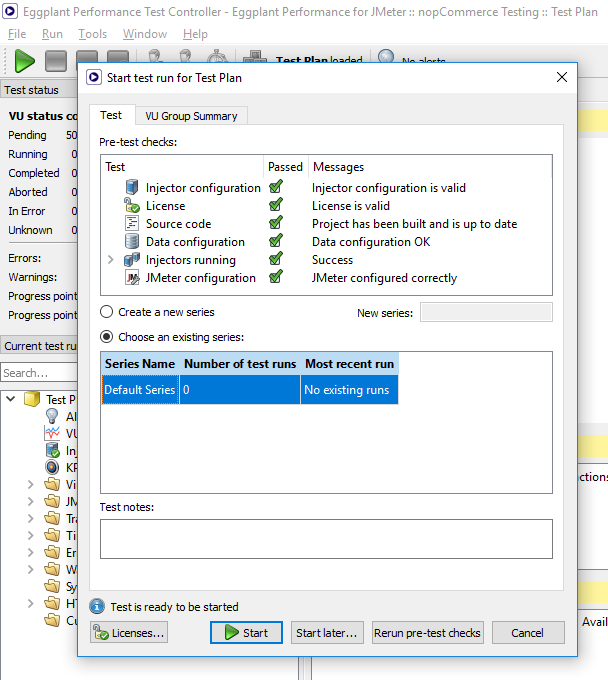
On Test Controller toolbar, click Start test (the green arrow button on the toolbar) to start a new test run.
The Start test run dialog box opens, and Test Controller performs a series of pre-test checks to ensure that everything is prepared to run the test. If any of the checks failed, you won't be able to start the test until you have met the requirements.
-
Click Start to begin the test run.
The Starting test dialog box opens and shows the progress of your test launch. When the injectors are started and all the necessary files transferred, this dialog box closes automatically. As the test runs, you can view live chart updates in the main Test Controller window.
-
When the test completes, click OK to dismiss the Test Run Complete dialog box. You can continue to review the test run metrics in the main window of Test Controller.
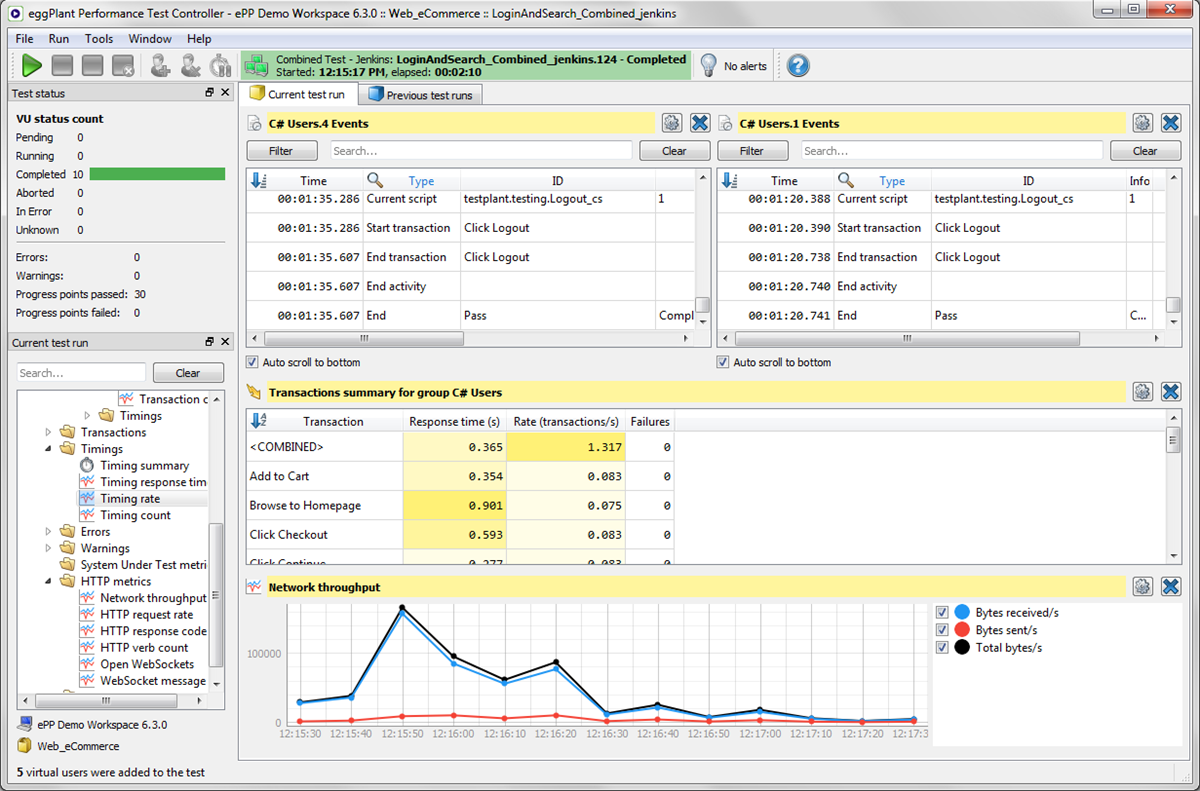
Viewing Virtual User Event Logs
Each virtual user (VU) creates an event log during test execution. To view event logs:
-
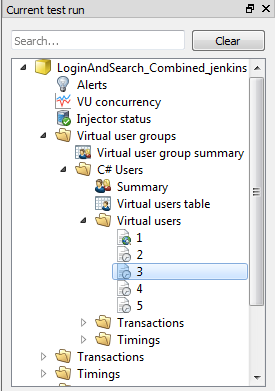
In the left sidebar, in the Current test run section, navigate to the VU for which you want to view the event log.
VUs can be found in the tree under Virtual user groups > <VU group name> > Virtual users, where <VU group name> is the actual name of the VU group. In the example below, the VU group name is C# Users. In the Virtual users folder, each VU is listed by number.
-
Double-click the VU you want to view. The VU event log opens in the main Test Controller window, just like any other table or chart.
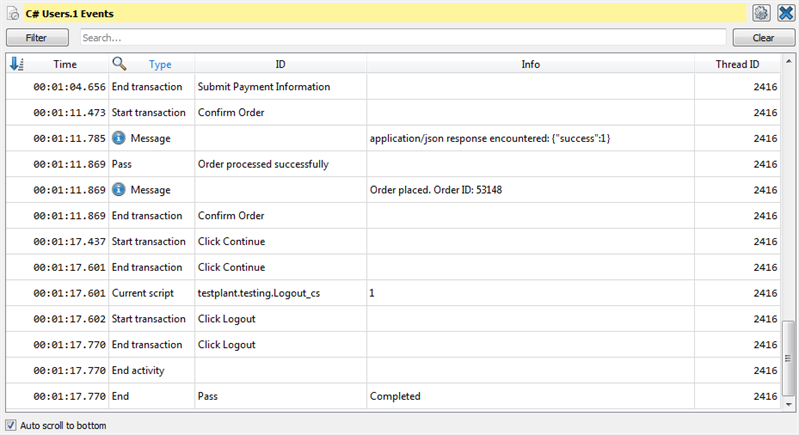
As with other metrics in Test Controller, the information presented in VU event logs is updated in real-time during test execution, and you can review data after test completion as well.
For more information about VU event logs, see Viewing VU Event Logs.
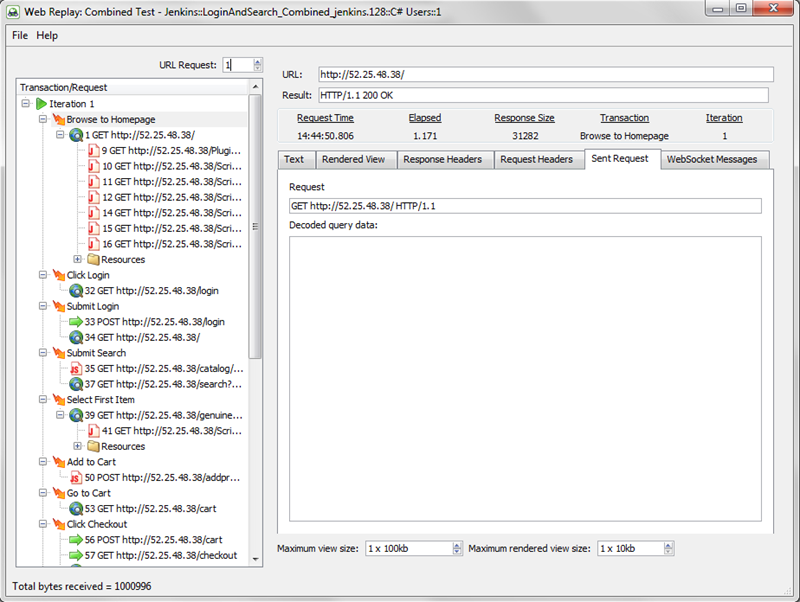
Viewing a Virtual User Web Log
Web virtual users create a web log in addition to the event log, which can provide information specific to the web environment. To view the web log for a specific VU:
-
In the left sidebar, in the Current test run section, navigate to the VU for which you want to view the event log.
You can find VUs in the tree under Virtual user groups > <VU group name> > Virtual users, where <VU group name> is the actual name of the VU group. In the Virtual users folder, each VU is listed by number.
-
Right-click a VU with the globe icon, then select Open web log. Only VUs with the globe icon have an associated web log.
-
Navigate to the Web Replay panel for detailed information about actual web requests and responses.
Next Steps
You can get more detailed test run analysis by using Eggplant Performance Analyzer. Continue to Viewing Eggplant Performance Test Results for information about analyzing and viewing your test results with Analyzer.