User Performance Monitoring (UPM)
User Performance Monitoring (UPM) enables you to reuse existing test assets, including test cases, models, and suites, and create a monitor that runs scheduled tests on a fixed frequency.
Information about creating and running monitors, as well as how to view their availability, performance, and results follows.
The UPM feature requires a license. Before you can use UPM, you must obtain and apply a license as described in Licensing the UPM Feature below.
Licensing the UPM Feature
The User Performance Monitor (UPM) feature is disabled by default. Follow the steps below to request and add a license for it:
-
Contact our Customer Support to request a UPM feature license for DAI.
-
When you receive the license, navigate to System > Licenses and enter it as described in Adding licenses on the DAI License page. Applying the license enables the Monitor option in the DAI menu on the left.
-
Display the Monitor drop-down menu to see the available options:
- Availability: Displays the Monitor Availability report
- Performance: Displays the Monitor Performance report
- Configuration: Displays the Monitor configuration page
- Runner: Displays the Monitor runner page
- Results: Displays the Monitior Results page
Creating a Monitor Configuration for UPM
Monitor configurations (monitor configs) contain a single test case to regularly run against systems under test (SUTs). They provide a series of test results for a time period that you can see on the Monitor Results page, and the Availability and Performance Reports.
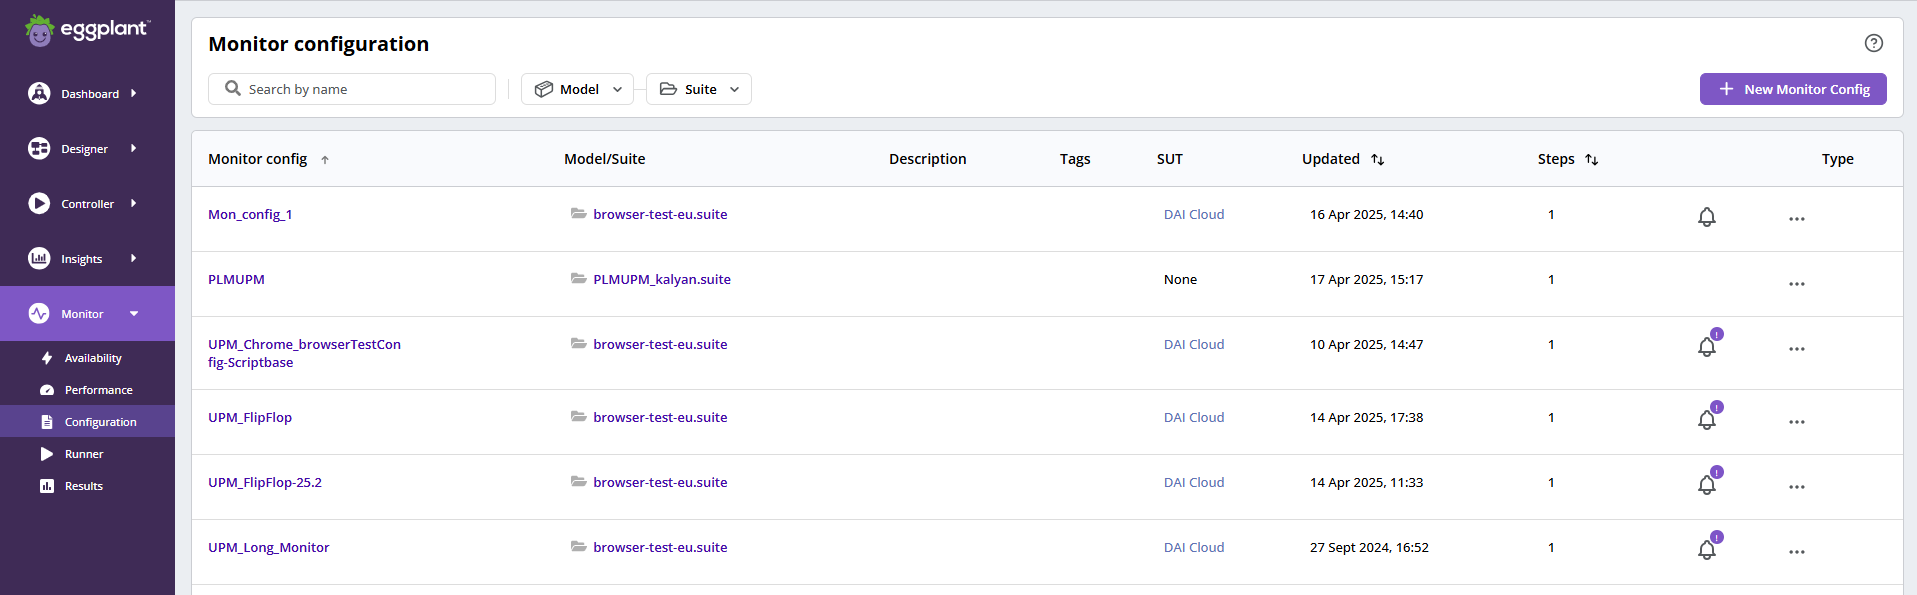
UPM Monitor Configuration
Because you will use UPMs to monitor applications or systems, your monitor configs need to be simple, reliable, and repeatable to be effective. The monitor config works like a test configuration (test config), but with the following two significant differences:
- You can add only one test case to a monitor config.
- You cannot add an exploratory test to a monitor config.
Excluding these two things, monitor configs provide all the functionality available in test configs. For more information, see DAI Test Configuration.
If you try to create a monitor config with the name of a monitor config that exists, or is the name of a DAI test config that exists, you see the error: 409 - Already exists. You need to specify a different name.
Running a Monitor Configuration
You can run a monitor configuration (monitor config) on demand from the Monitor runner while scheduling it to operate at regular intervals. More information is available in the Scheduling Option: See DAI Runner>Scheduling Options.
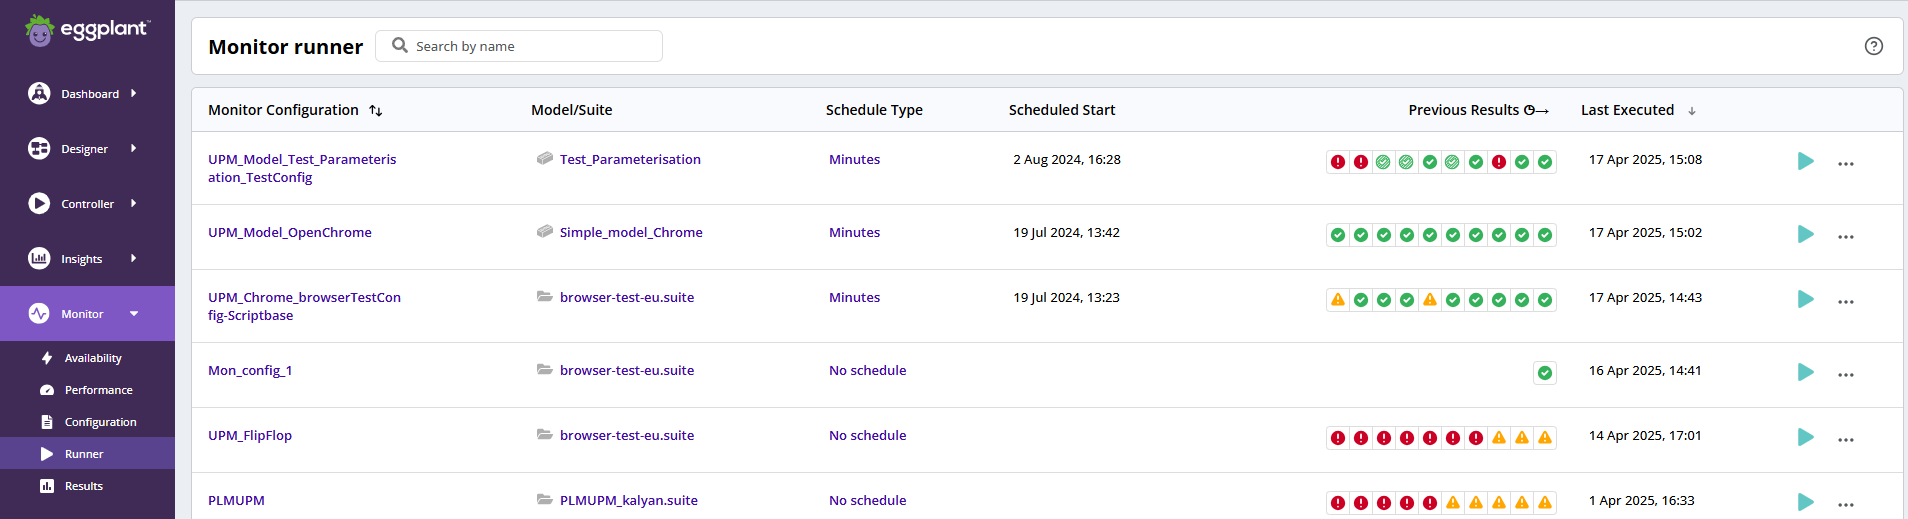
UPM Monitor Runner
Since a UPM monitor config is likely to run continually, it does not provide a Run once at selected time option.
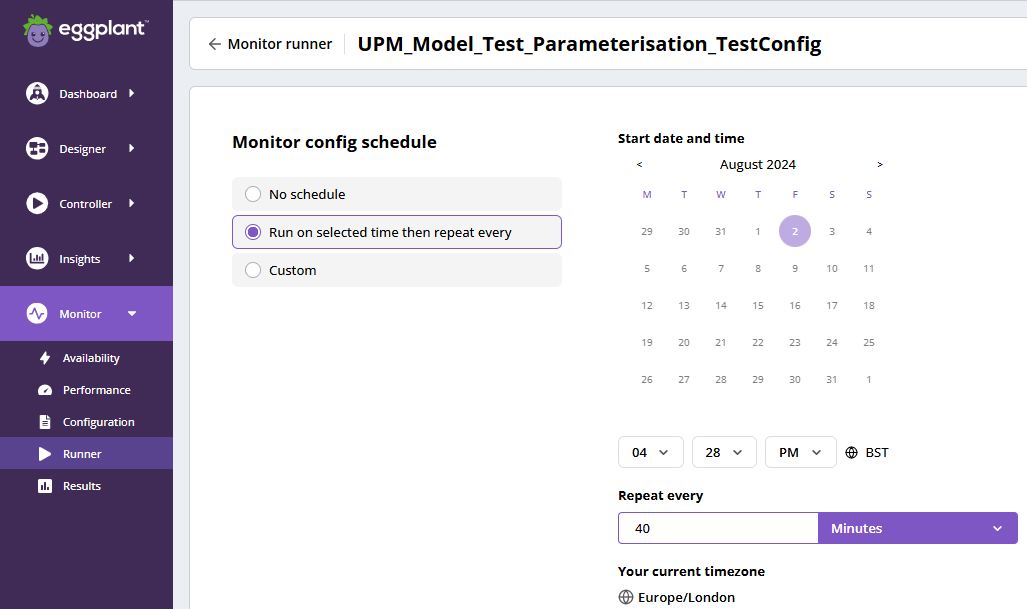
UPM Monitor Scheduler
Viewing the Monitor Results
The UPM results, which are on the Monitor Results page, are the same as the results on the Test Results page, and provide all the features available on the Test Results page. More information is available in the Test Results section: See DAI Test Results.
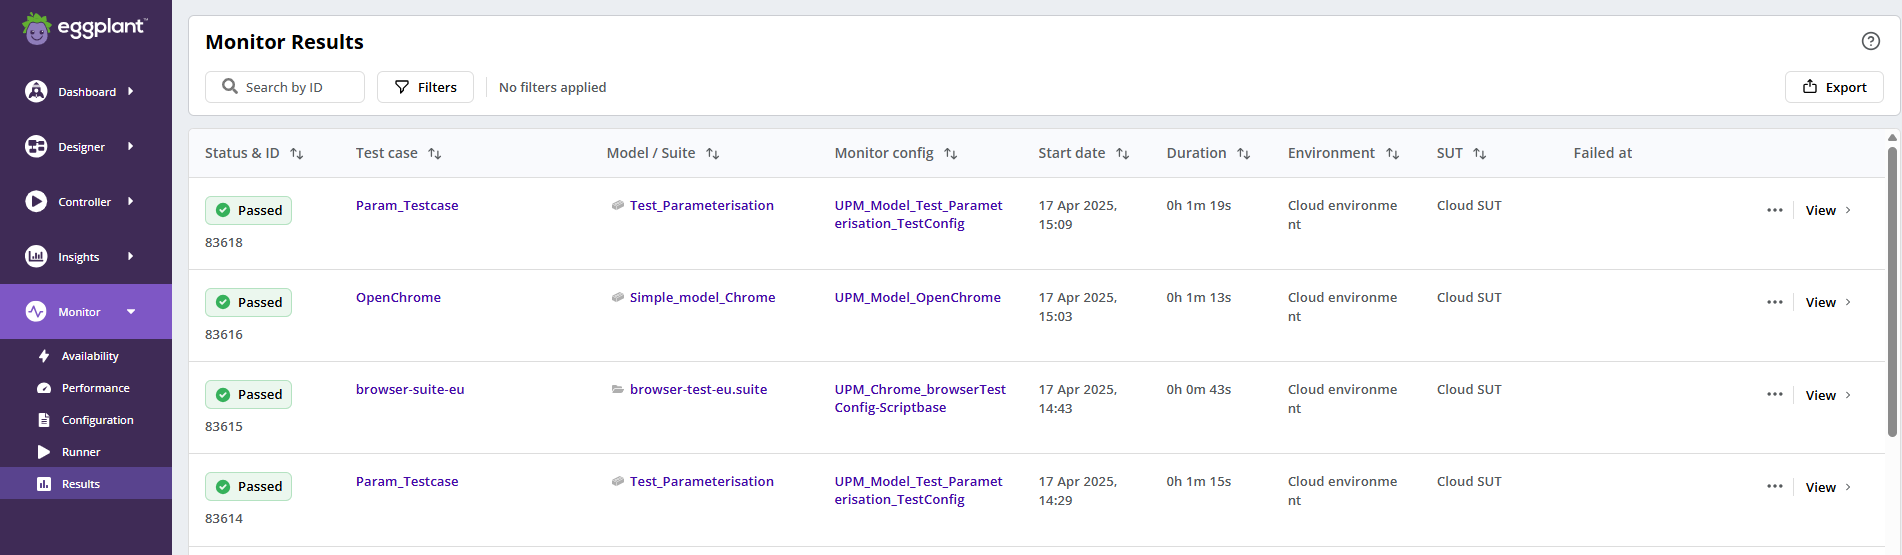
UPM Monitor Results
Viewing the Monitor Availability Report
The Monitor Availability report displays the tests that run over the set time period and their status. It shows which of your tests have passed, failed, had errors, are in progress, or have been cancelled over time, and provides an overview of the monitor config's availability. The report provides filters for you to select the date and time ranges you want to view of the monitor configs’ availability. You can filter some results using the Run Type and Run Status filters.
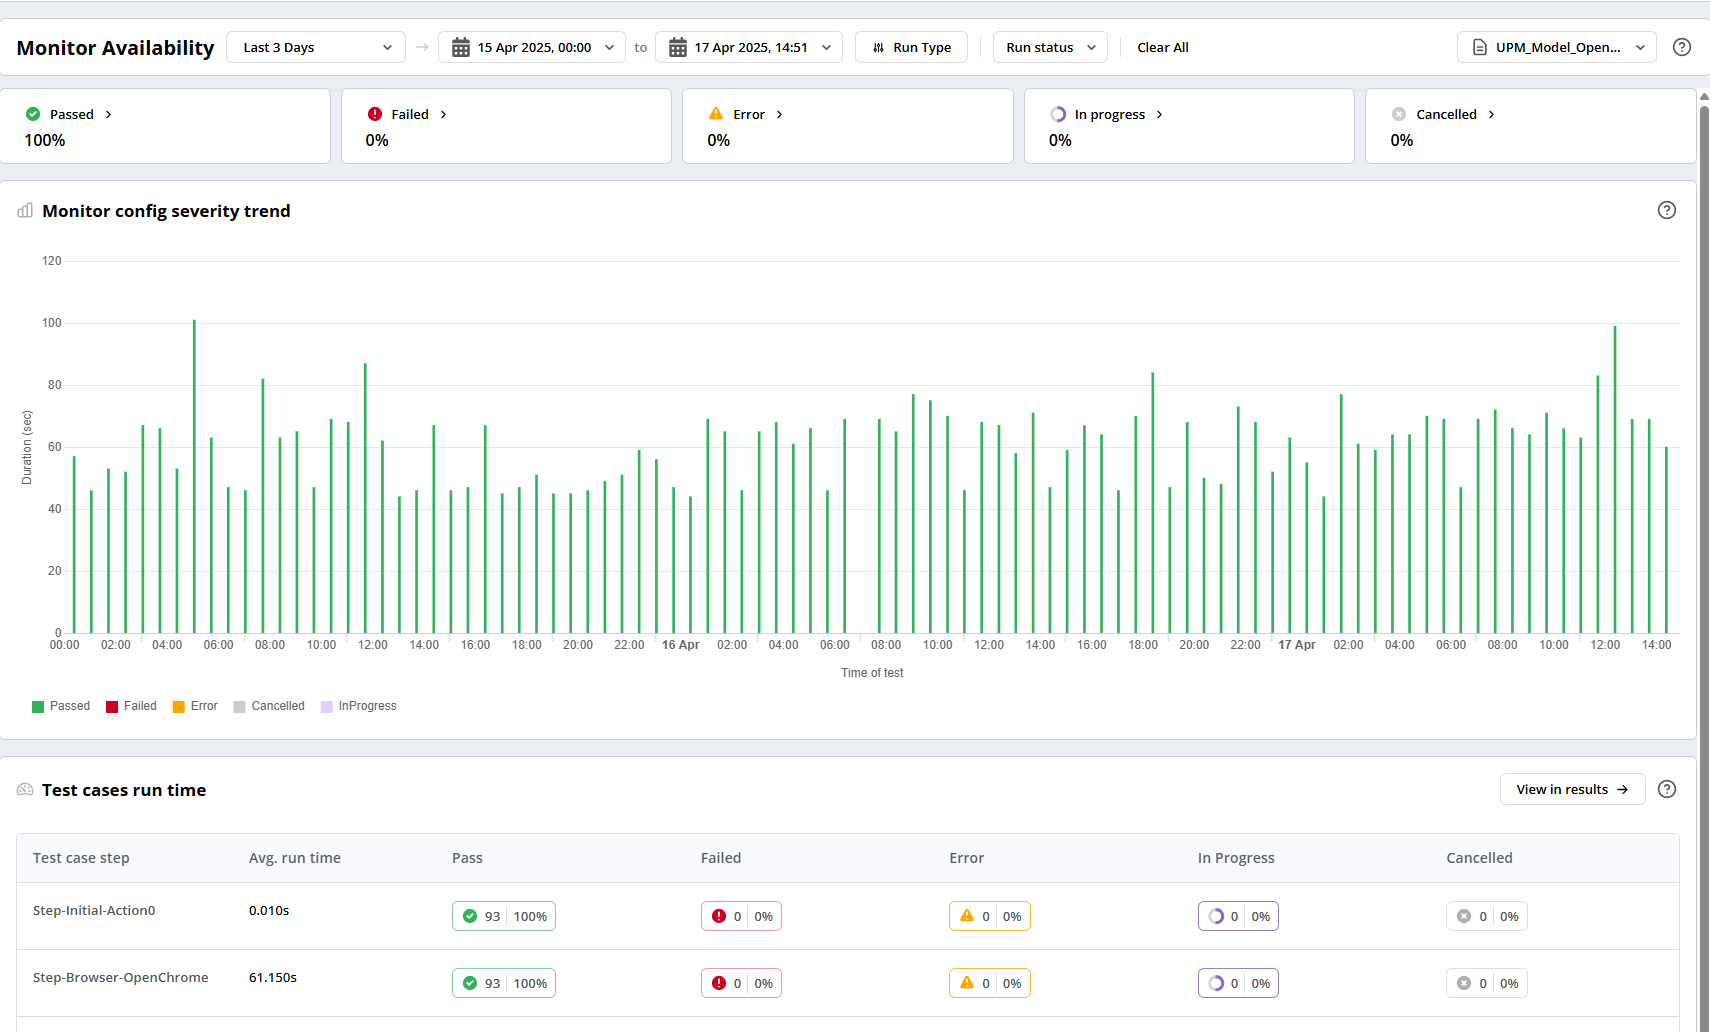
UPM Availability Report
The header panel displays the percentage of each status, and you can click through from the status to view its results. This allows you to investigate any monitor config failures.

UPM Availability Report Header
Using the availability trend chart, you will be able to see the monitors' availability trend over a time period and spot if you have any issues with the application’s performance and availability that the monitor config is monitoring. You can click the Availability report's legend to show or hide statuses to help you focus on a specific status, and you can click on a particular test in the chart to view the test logs, events, and screenshots.
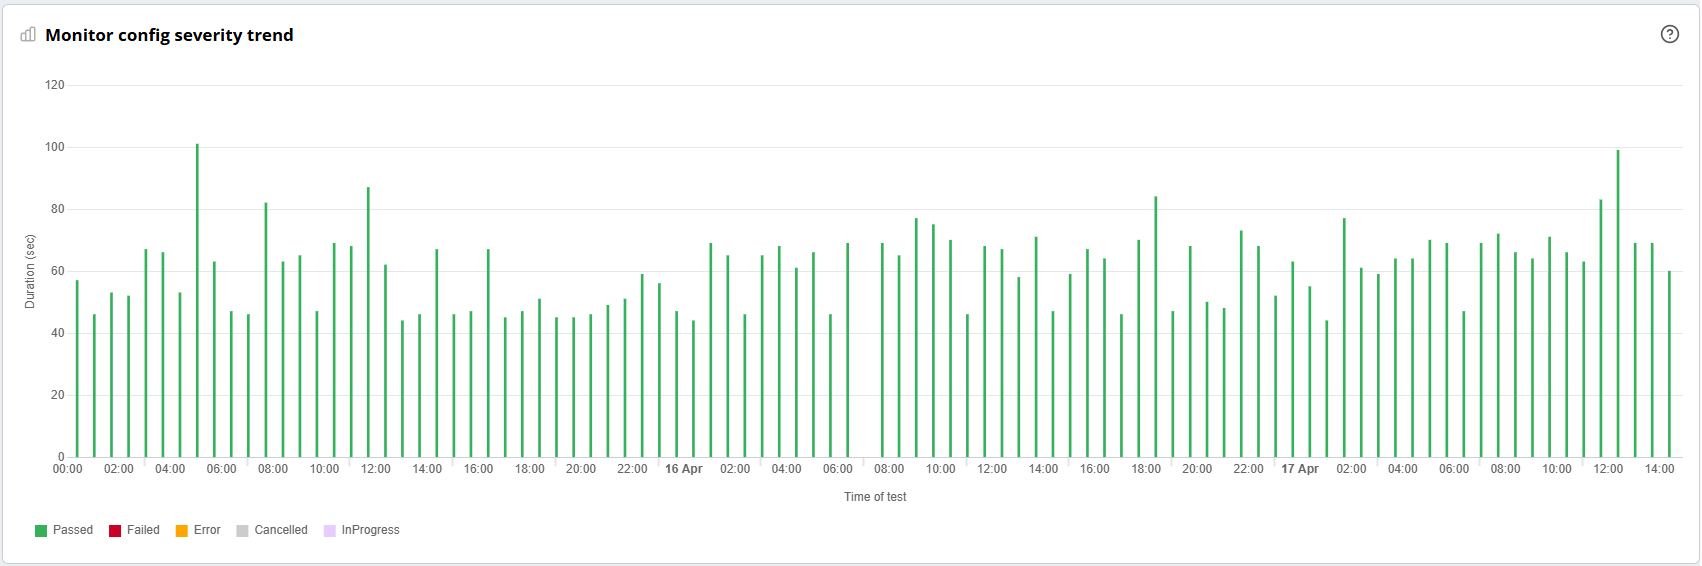
UPM Availability Report Trend Chart
The footer displays the aggregated data, such as the average run time (Avg. run time) of the test case, the number of tests run, and the percentage for each status of the test case used in the monitor configuration. There is also an option to click through from the footer table to view all the test results for the selected time range.
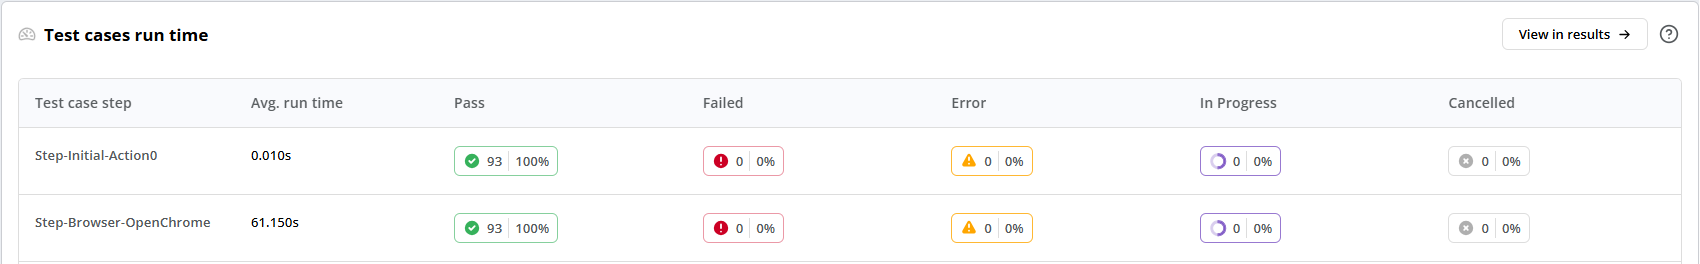
UPM Availability Report Footer
Viewing the Monitor Performance Report
The Monitor Performance report displays the tests that run over a time period and their test case step break-down performance.
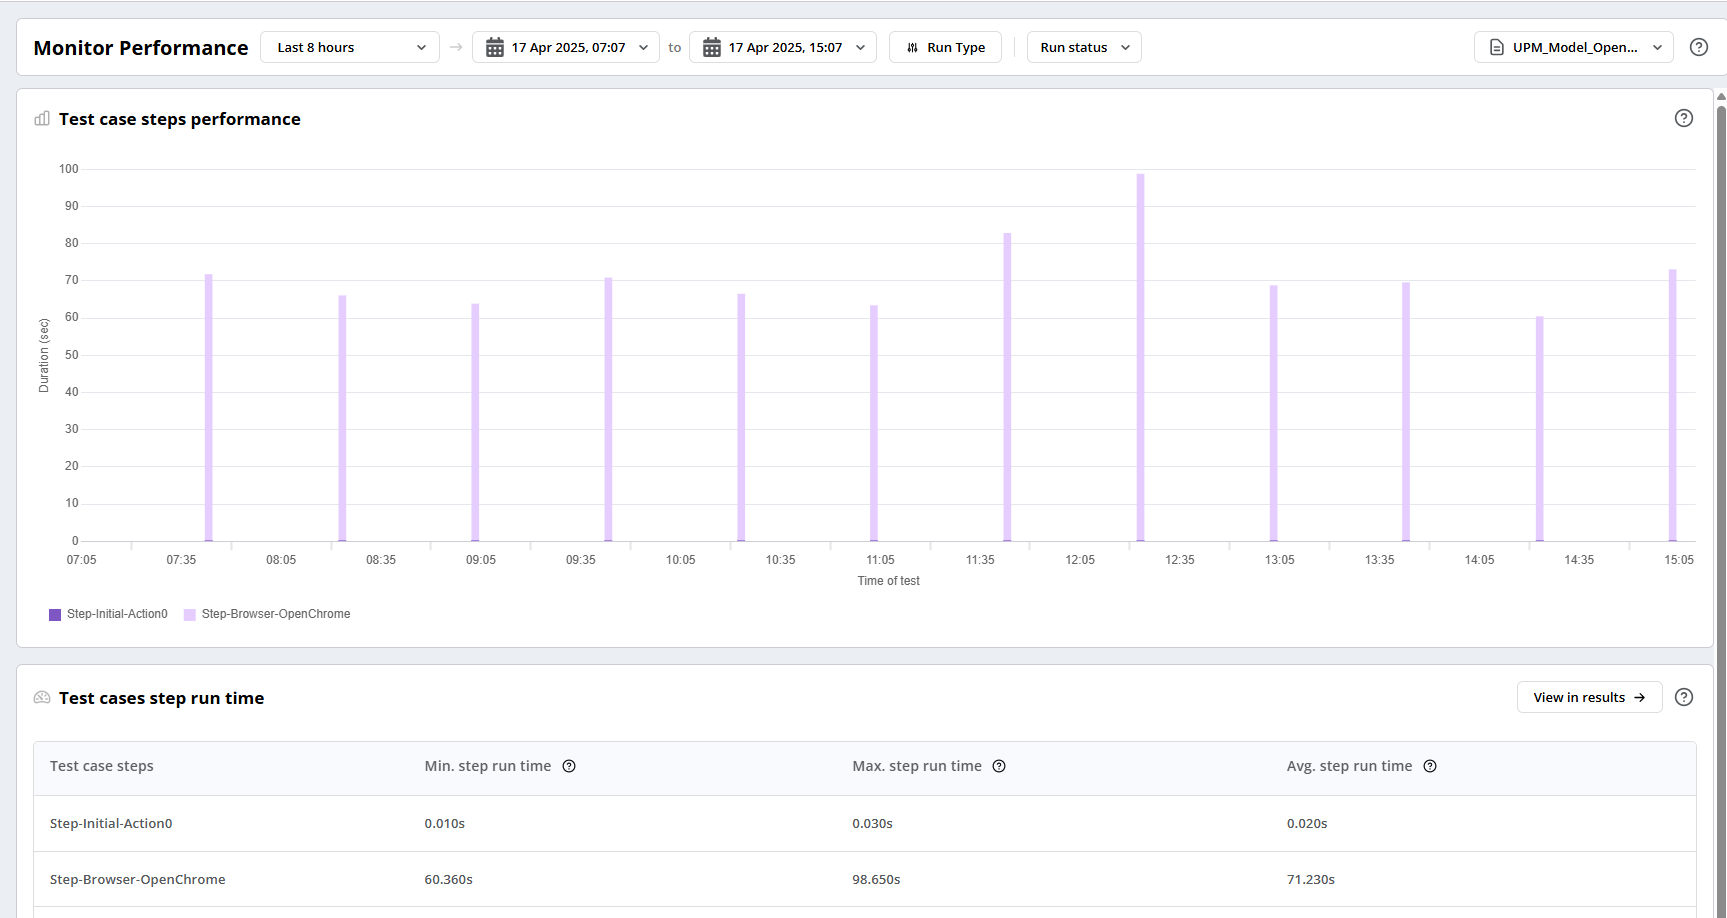
UPM Performance Report
Filters available at the top of the report enable you to select the date and time range during which you want to view the monitor configs’ performance. You can filter some results using the Run Type and Run Status filters.

UPM Performance Report Header
Using the performance chart, you can see the performance of all the steps available in the test case used in the monitor config. You can click the Monitor Performance report's legend to show or hide test case steps to help you focus on a specific step, and you can click on a particular test in the chart to view the test logs, events, and screenshots.
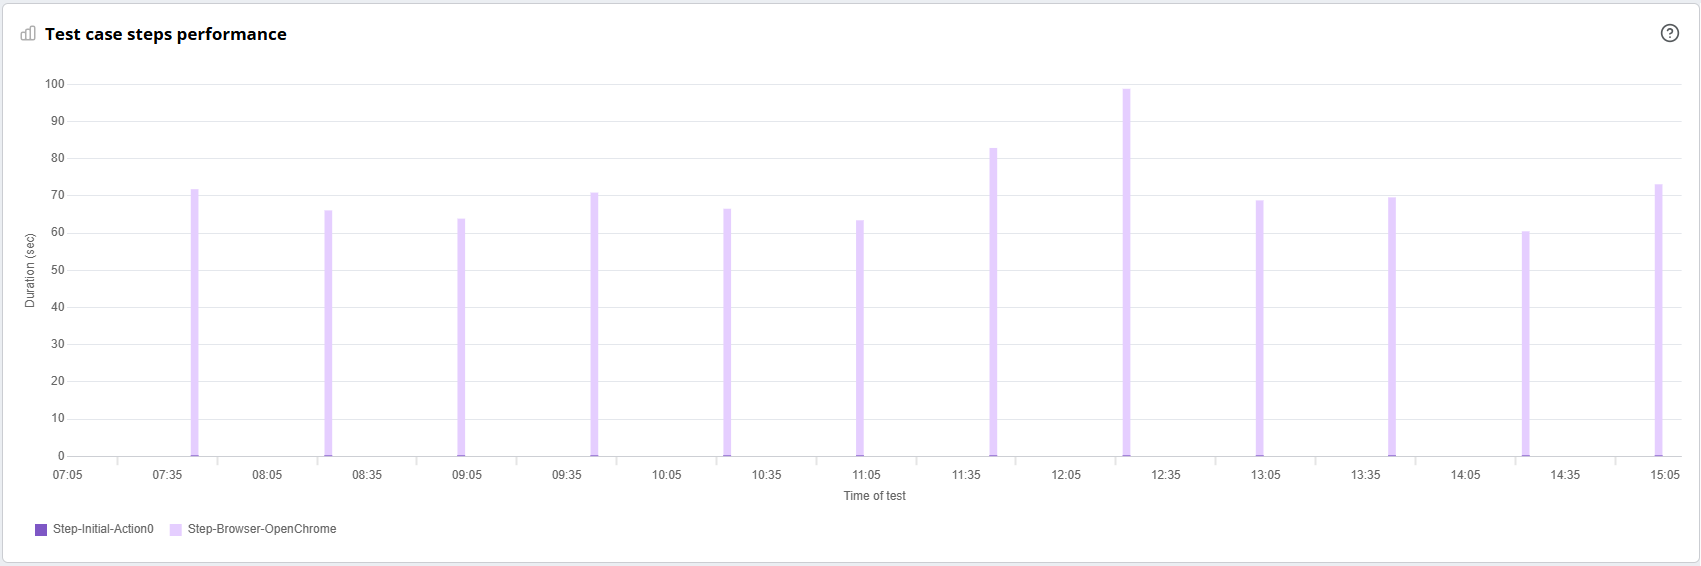
UPM Test Case Step Performance Report Chart
The footer displays the aggregated data at the step level for the test case, such as the Min. step run time, Max. step run time, and Avg. step run time. There is also an option to click through from the footer table to view all the test results for the selected time range.
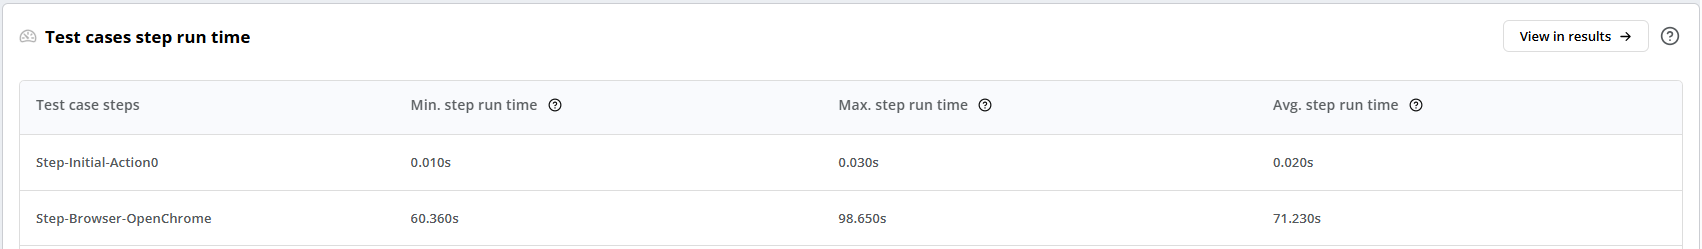
UPM Performance Report Footer