Test Case Dashboard
The Test case dashboard provides an overview of the various test case reports for both script-based and model-based test cases. You can use this dashboard to gain insights and analyze aggregated data for all your test cases, enabling you to make informed decisions and enhance your testing processes. By default, the dashboard shows data from the last 7 days, covering all your models and suites. However, you can tailor the view by customizing both the date range and applying filters to focus on a specific model or suite as needed.
- Information about test cases created before DAI version 6.1 will not show in this dashboard because they do not have test case IDs.
- The total Number of Test Case Results on the Test Case Dashboard may differ from the Number of Test Results.
Launching the Test case dashboard
To get started, simply go to Dashboards > Test Case.
Test case dashboard
The following reports make up the Test case dashboard. Each one provides a help (?) button to provide explanations of the data they are reporting.
- Filters
- Test case run summary bar
- Test case runs per day
- Test case results by status
- Top 10 longest running test cases
- Top 10 test case failures
- Top 10 test case errors
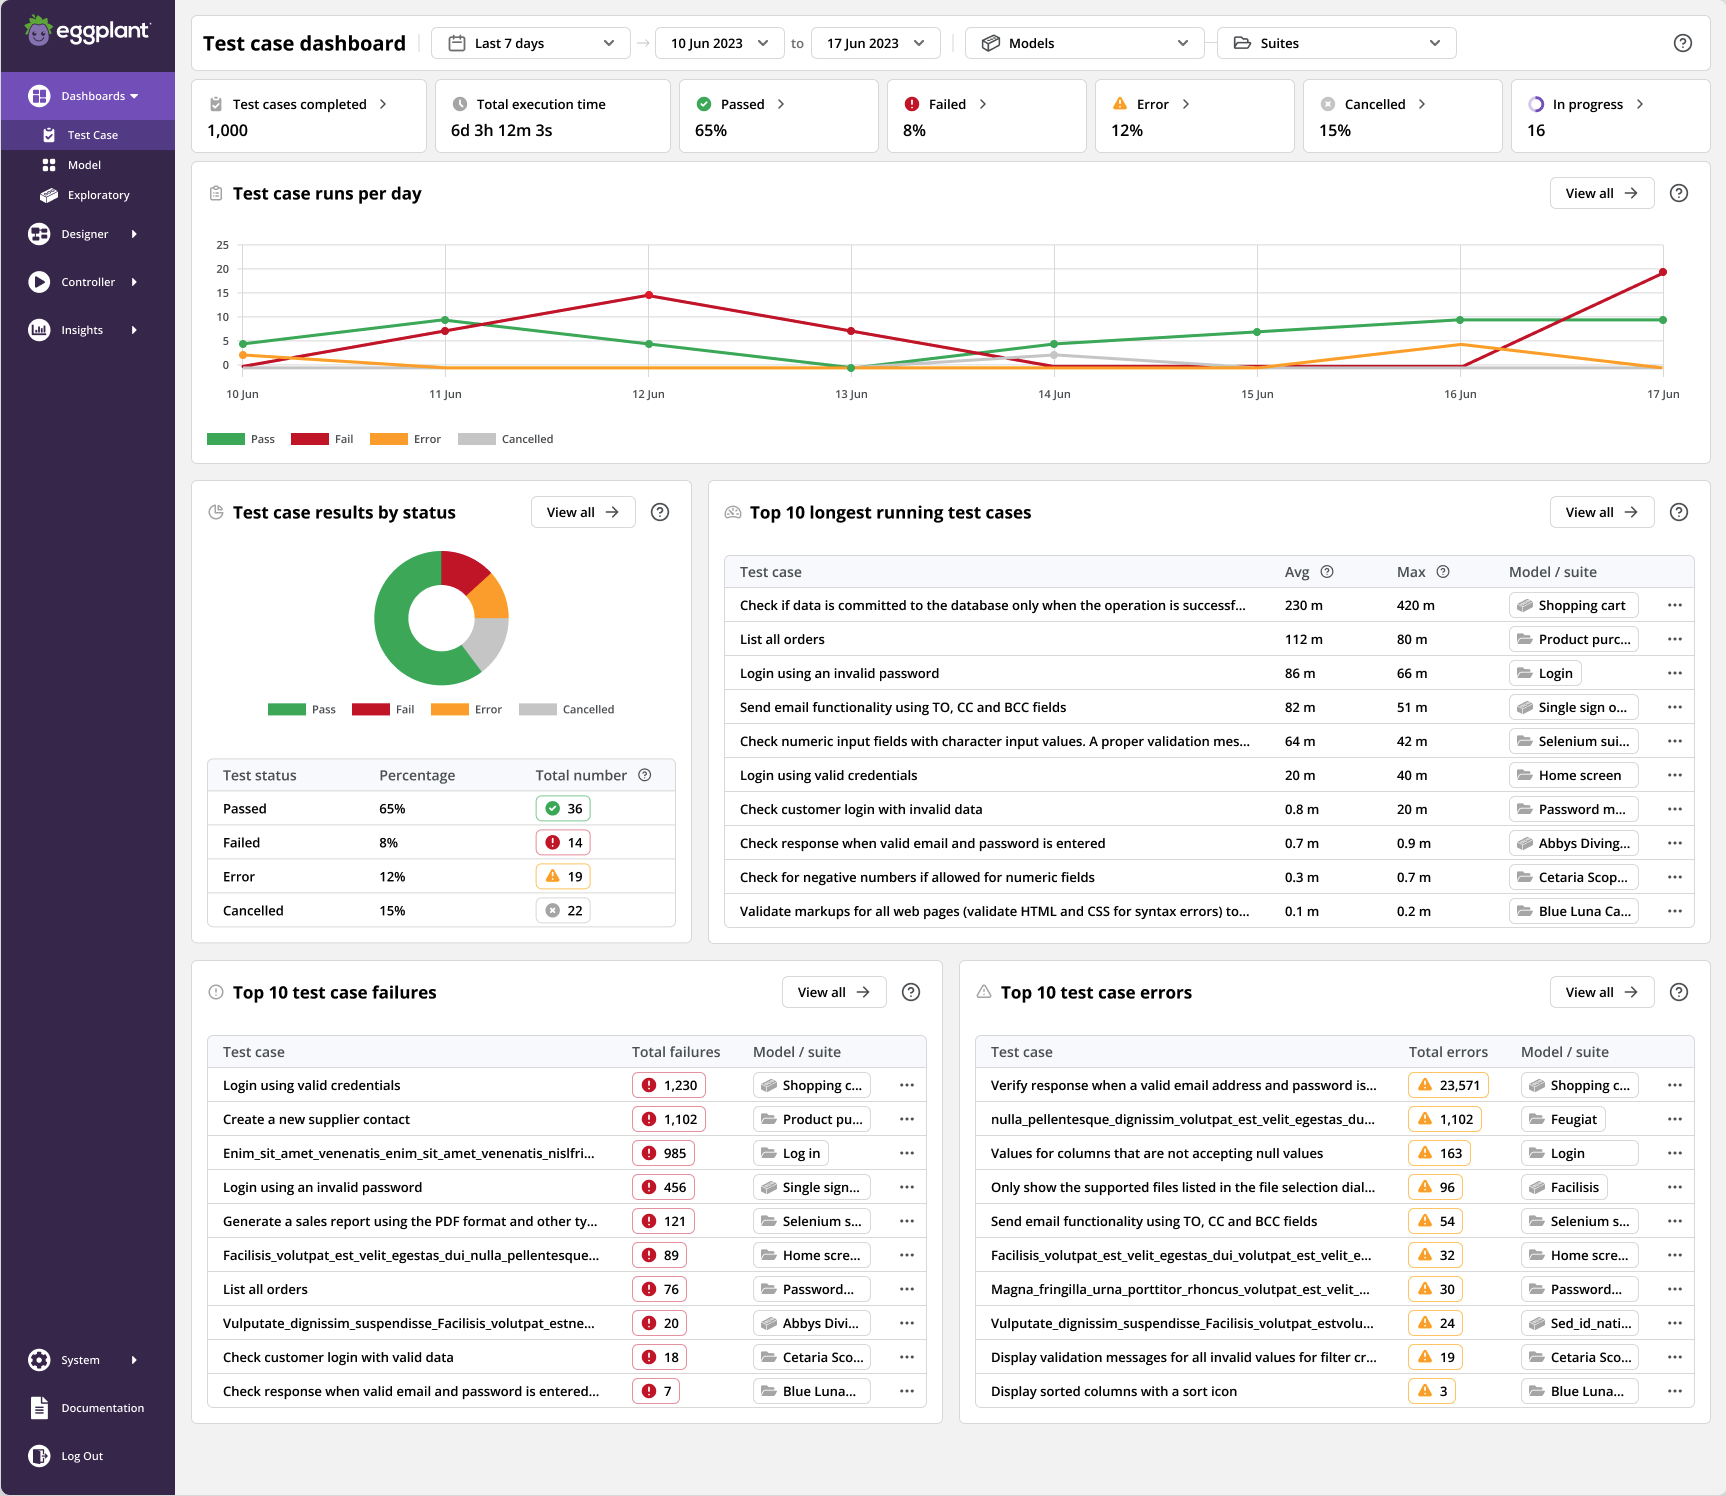
The Test case dashboard
Note: All reports appear blank until you run at least one test case either as a model execution or as a Directed Test Case.
Filters
Dashboard filters let you customize all test case reports on your dashboard according to your specific needs. You can personalize your dashboard by adjusting the date range and applying filters on specific models or suites.

Test case dashboard filters
- Date range: You can set up a custom date range to view the Test Case Dashboard over a specific period. By default, the dashboard displays results from the last 7 days.
- Model or Suite: Choose to filter by a specific model or suite, to narrow down to the desired scope.
Test case run summary bar
The Test case run summary bar offers a high-level overview and quick access to various test case statistics based on the applied filters at the dashboard level.

Test case dashboard run summary bar
Some reports include buttons with arrows that allow you to view the list of test case results:
-
Test cases completed: shows the total number of test cases that have been completed.
-
Total execution time: shows the cumulative execution time taken for all test case executions.
-
Passed: shows a count of test cases that have passed successfully.
-
Failed: shows the number of test cases that failed.
-
Error: shows the test cases that encountered errors during execution.
-
Cancelled: shows the test case runs that were cancelled.
-
In progress: shows the test cases that are currently running, allowing you to track ongoing testing activities.
Test case runs per day
The Test case runs per day report offers insight into the distribution of different test case outcomes over time based on the applied filters at the dashboard level.
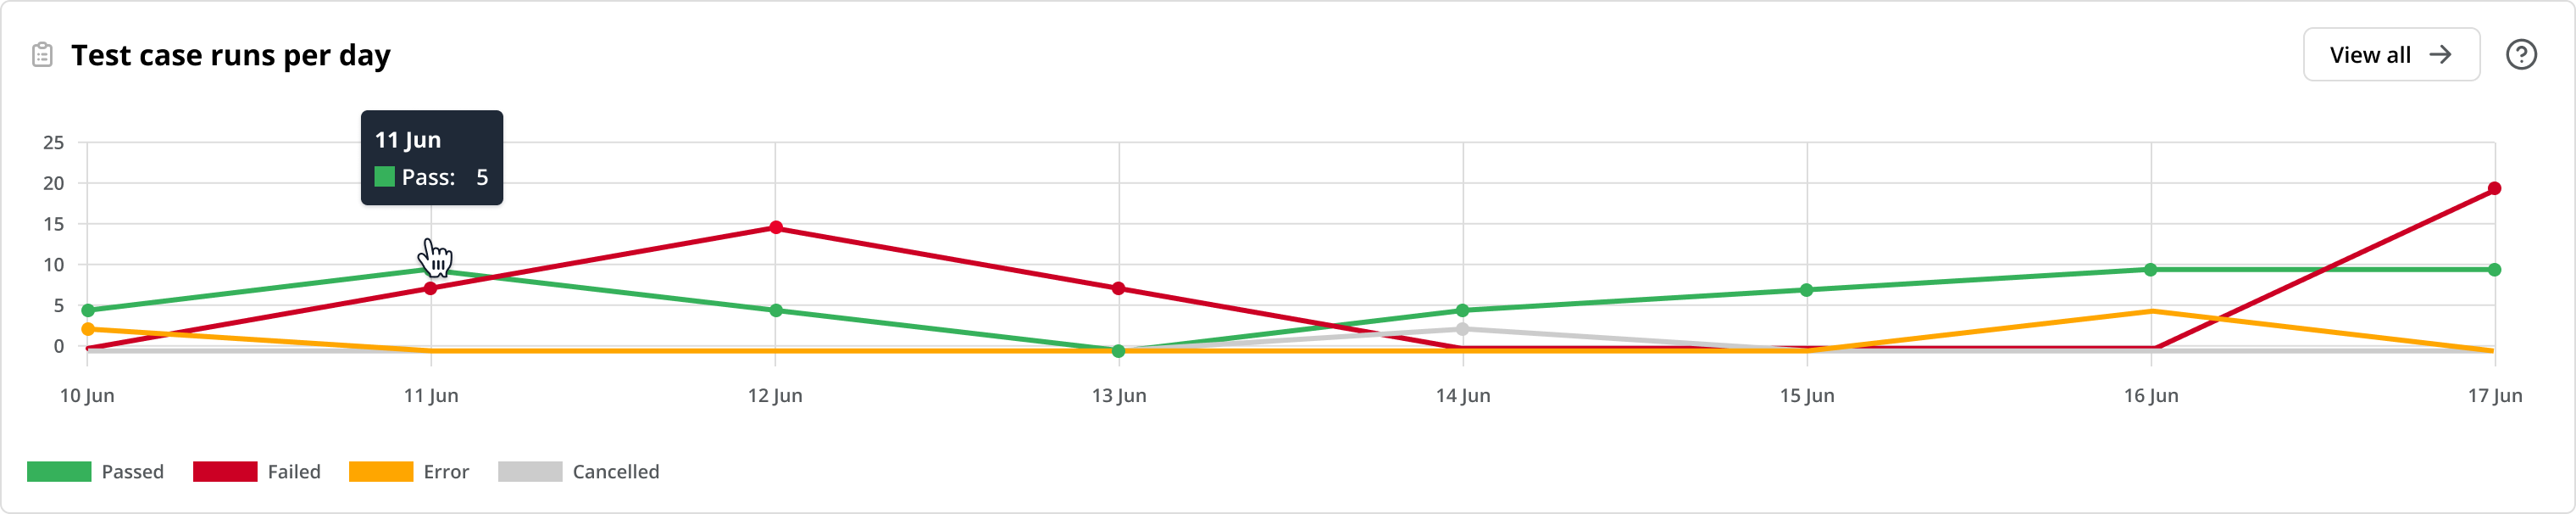
Test case runs per day report
-
Graph: provides a visual representation of Passed, Failed, Error, and Cancelled test case results per day. Hover over data points on the lines to see the date and run outcome.
-
View all: click this button to see a list of all test cases and their outcomes on the Test Results page.
Test case results by status
The Test case results by status report provides insights into the status disribution of your test cases based on the applied filters at the dashboard level. This report allows you to track and understand the overall performance of your test cases.
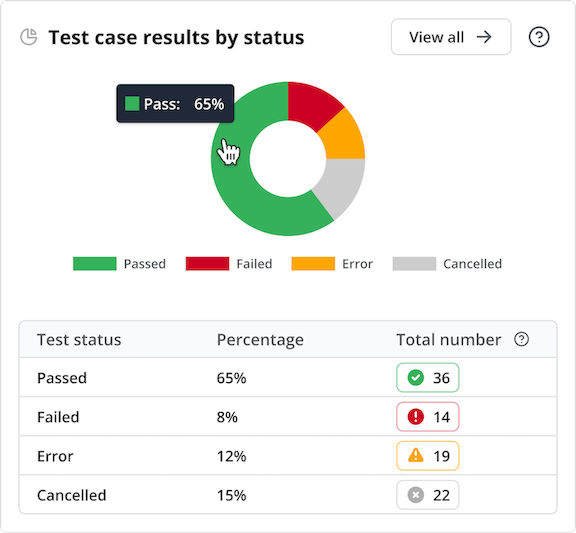
Test case results by status report
-
Run status breakdown donut chart: shows the distribution of test cases across different run statuses (Passed, Failed, Error, and Cancelled), providing their relative proportions. By clicking on each status, you can access the list of test case results by status.
-
Run status table: shows the total number and percentage of test cases by run status (Passed, Failed, Error, and Cancelled). You can click on each status to access the list of test cases by status.
-
View all: click this button to see a list of all test cases and their outcomes on the Test Results page.
Top 10 longest running test cases
The Top 10 longest running test cases report identifies the top 10 longest test case runs based on the applied filters at the dashboard level. This report provides insights into the execution time of your tests, showing both the maxiumum and average time taken for each test case to run. This report also shows the model or suite they belong to, allowing you to identify and address performance issues.
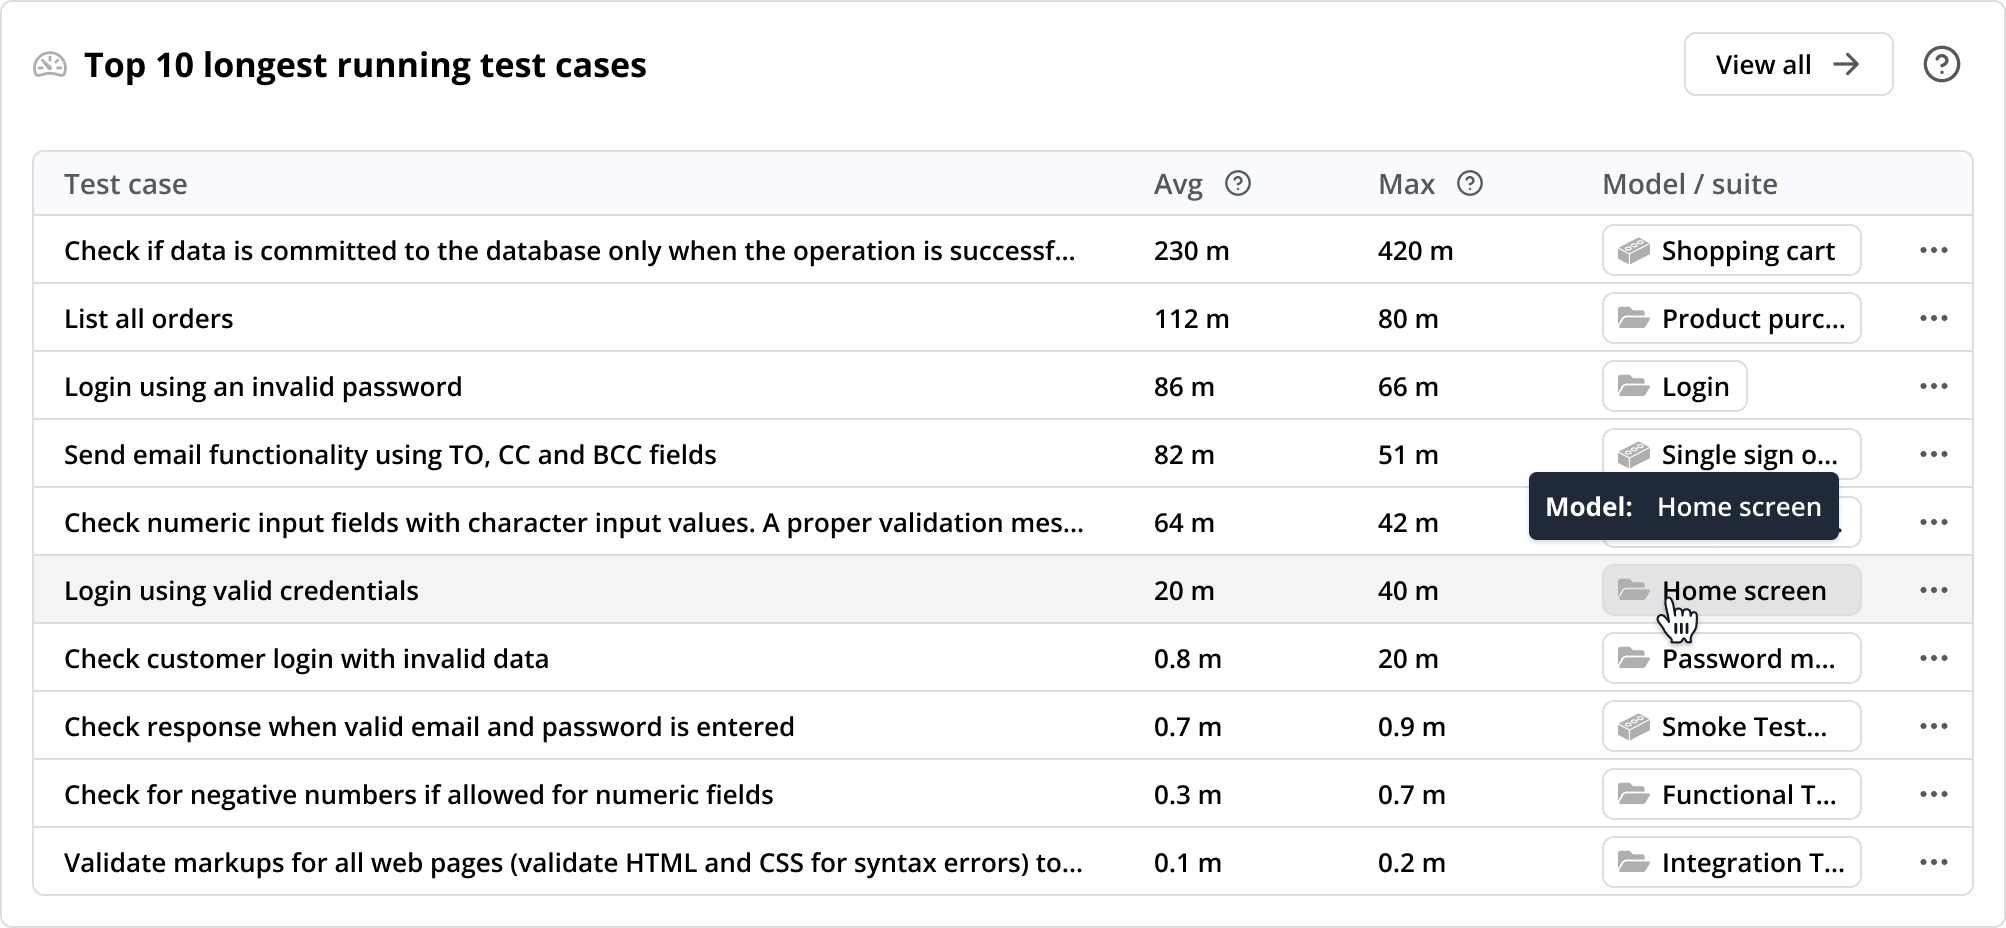
Top 10 longest running test cases report
-
Test case: shows the names of the 10 longest running test cases.
-
Execution time: Shows the maximum and average execution time for each test case run, enabling you to understand the performance of your test cases.
-
Average time to execute (Avg): the average time it took to execute for all test runs.
-
Maximum time to execute (Max): the maximum time it took for a test run to execute.
-
-
Model/Suite: shows the the model or suite that a test case uses.
-
Test case results: click a test case to open it on the Test Results page to gain a comprehensive understanding of its execution time.
-
Test case actions menu: click the three dots menu to open a specific test case in a new tab where you can view or edit it.
-
View all: click this button to see a list of the 10 test cases and their outcomes sorted by the average time it took to execute on the Test Results page.
Top 10 test case failures
The Top 10 test case failures report shows the test cases that encountered the highest number of failures based on the applied filters at the dashboard level. This report helps you focus on areas that require immediate attention.
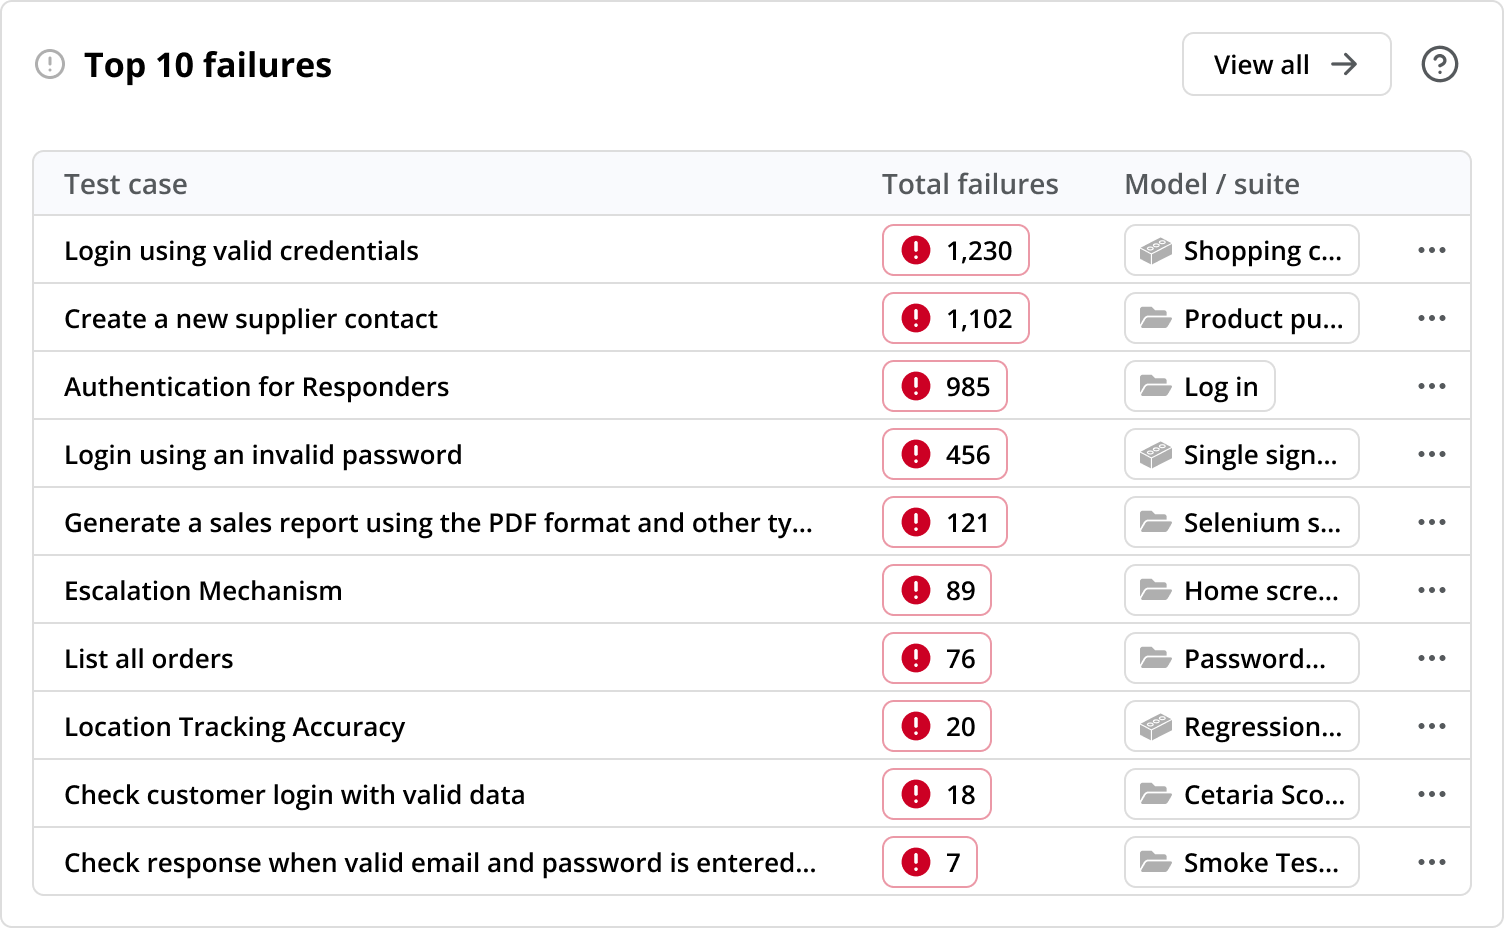
Top 10 test case failures report
-
Test case: shows the names of the 10 test cases with the highest number of failures.
-
Total Failures: shows the number of failures in descending order for the 10 test cases with the highest number of failures. This allows you to pinpoint recurring issues.
-
Fail overview: click a test case and explore all of its failures to gain a deeper understanding of the encountered issues.
-
Model/Suite shows the model or suite that a test case uses.
-
Test case actions: click the three dots actions menu to open a specific test case in a new tab where you can view or edit it.
-
View all: click this button to see the list of all the test cases that failed on the Test Results page.
Top 10 test case errors
The Top 10 test case errors report shows the test cases that have encountered the highest number of errors based on the applied filters at the dashboard level. This report helps you identify recurring errors and focus on areas that require attention.
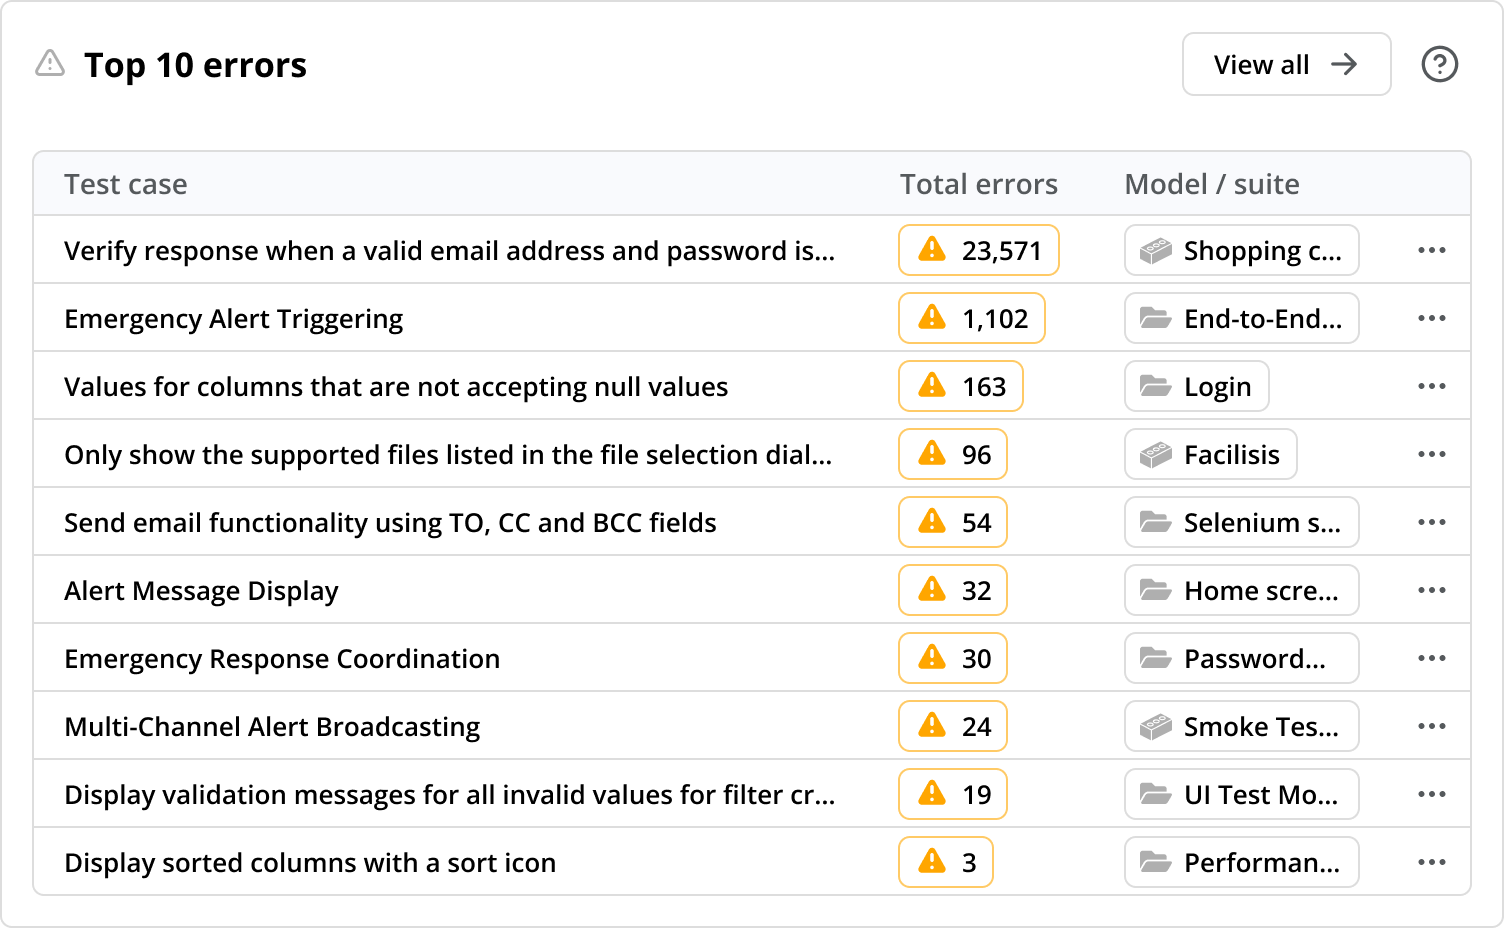
Top 10 test case errors report
-
Test case: shows the names of the 10 test cases with the highest number of errors.
-
Total Errors: shows the number of errors in descending order for the 10 test cases with the highest number of errors.
-
Error overview: click individual test cases and explore their errors to gain a deeper understanding of the encountered issues.
-
Model/Suite shows the model or suite that a test case uses.
-
Test case actions: click the three dots menu to open a specific test case in a new tab where you can view or edit it.
-
View all: click this button to see the list of all the test cases that have errors on the Test Results page.