Model Dashboard
The Model dashboard page shows a recap of your recent directed and exploratory testing in DAI. To populate the summary, select a Model from the drop-down list. The summary shows results from the last 7 days by default, but you can customize the date range as needed.
Launching the Model Dashboard
To get started, simply go to Dashboards > Model.
The Model Dashboard
The following widgets make up the Model Dashboard:
- Model Selector
- Date Range Filter
- Test Results Record
- All Runs (Exploratory/Directed)
- Test Case Completion (Directed)
- Failure Type
- Coverage
- Test Breakdown
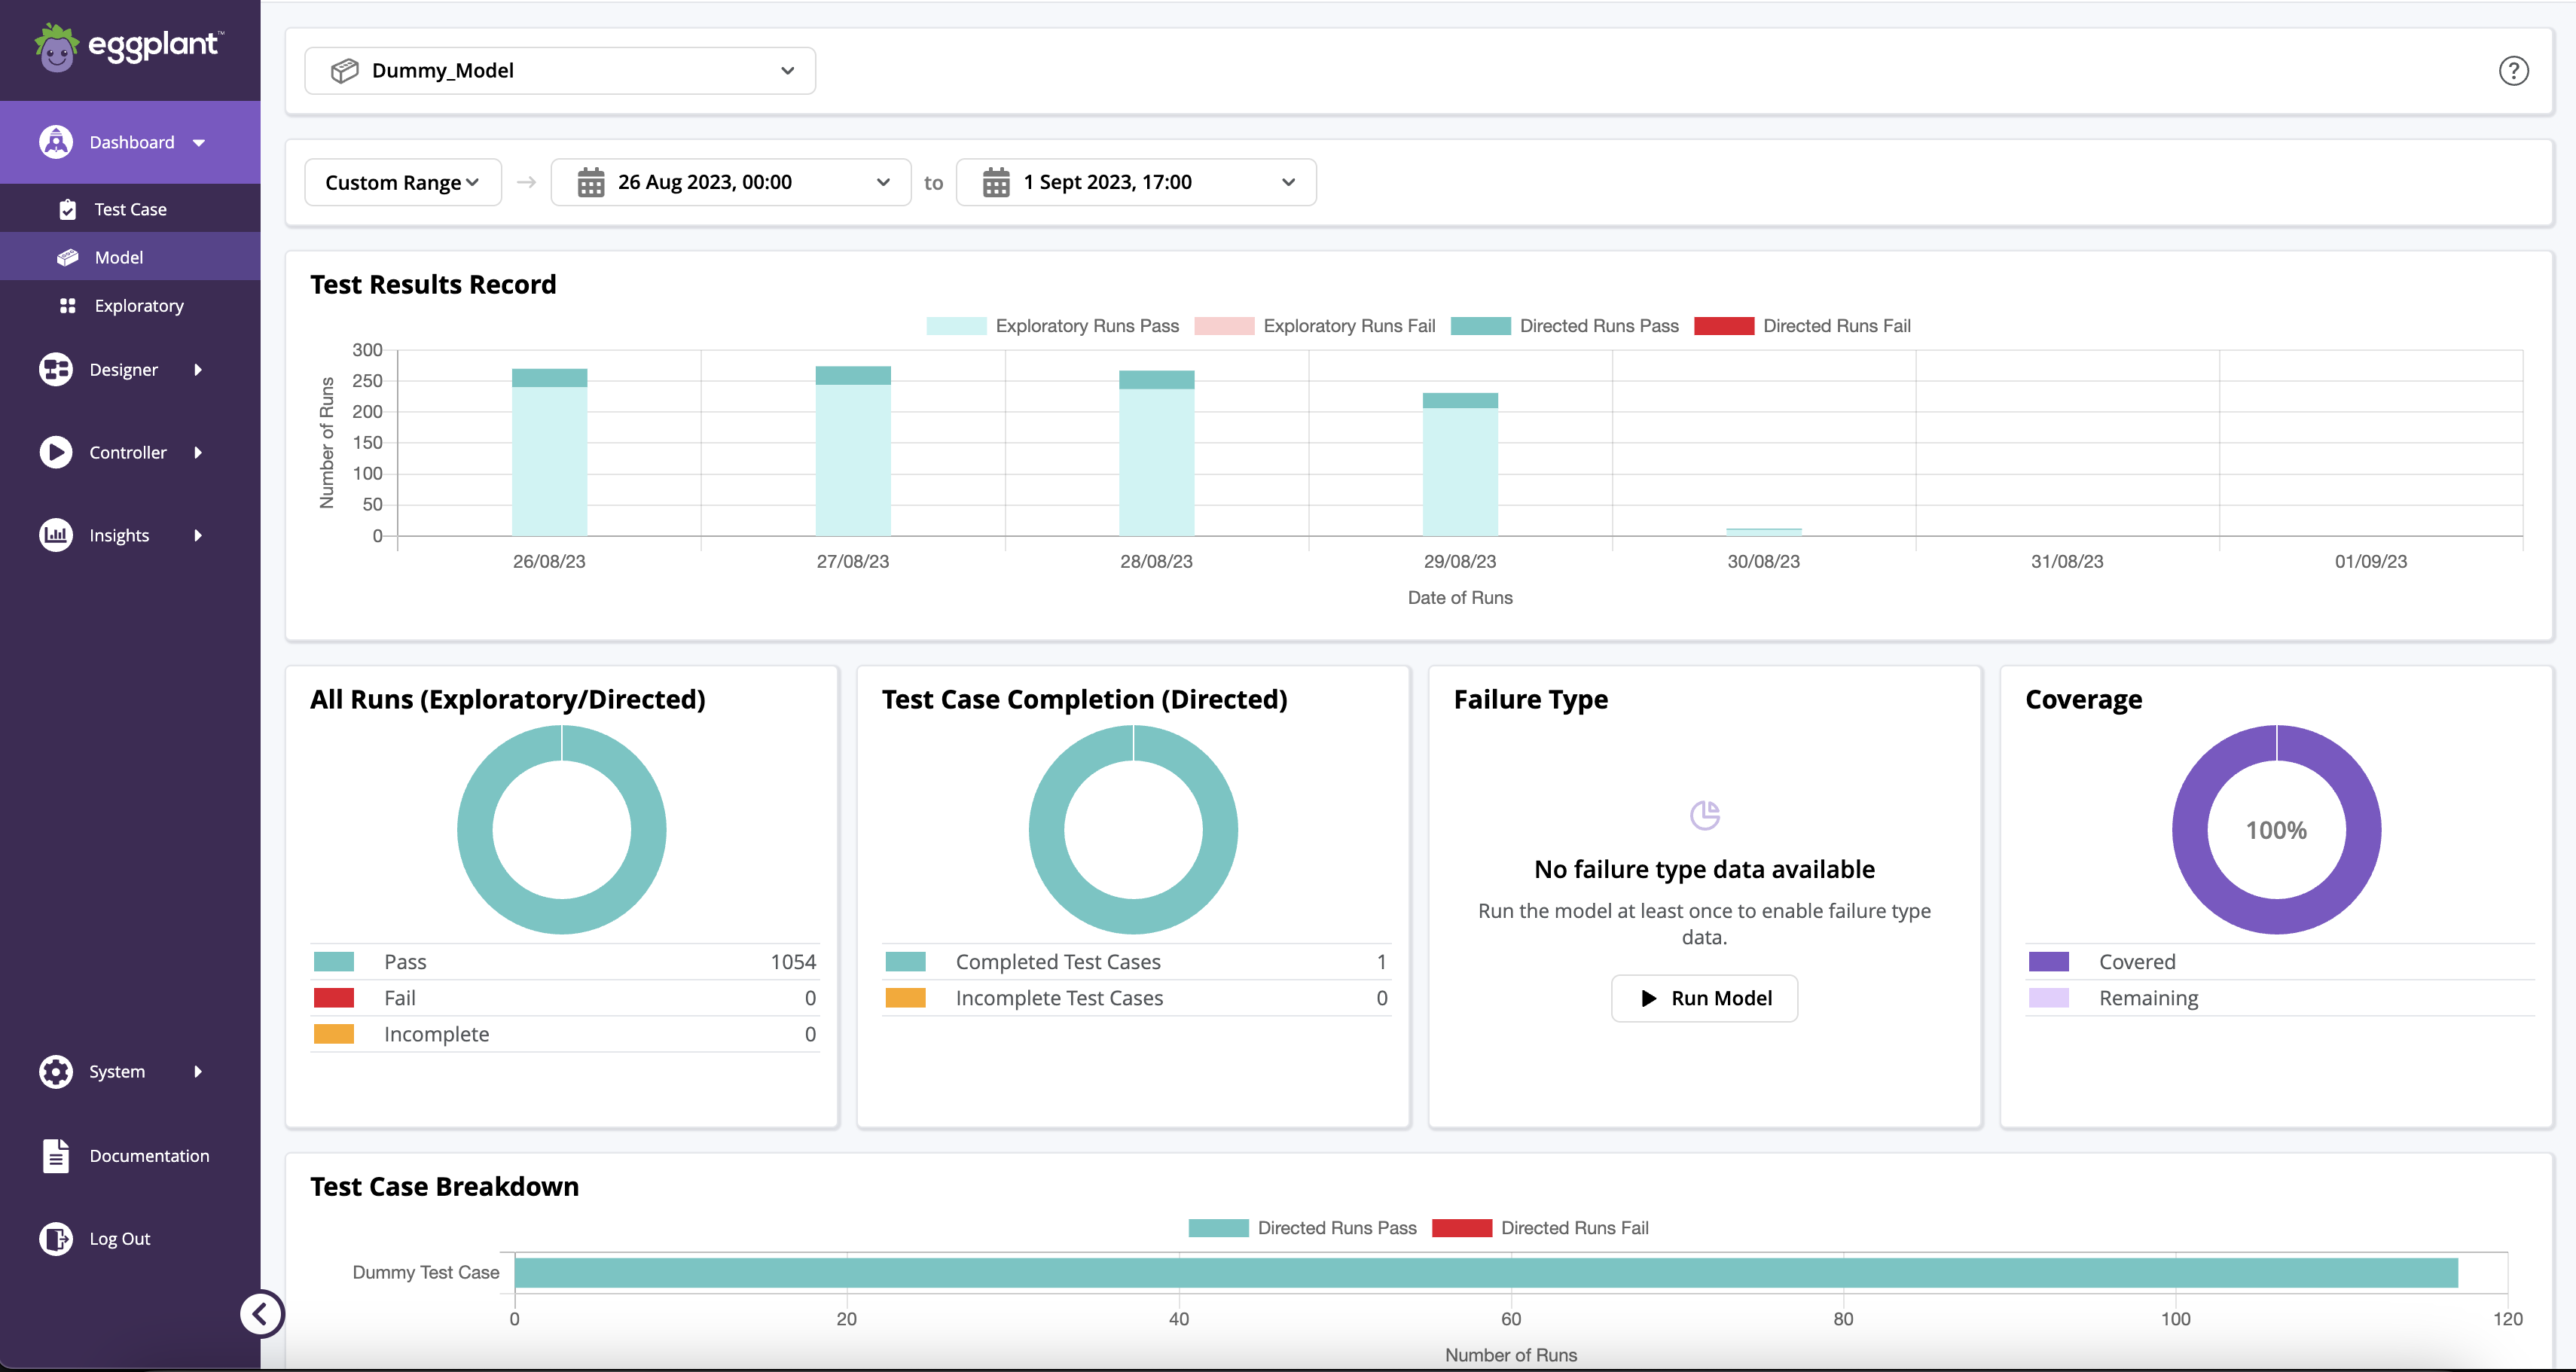
The Model dashboard
Model Selector
The drop-down list of available models that you can select to view in this dashboard. The selector also provides a search capability, so the list shortens when you start typing to help you quickly find the model you want.
Date Range Filter
You can either:
- View the collected summary data for a standard date range: Today, Yesterday, Last 3 days, Last 7 days, Last 2 Weeks, Last 3 Weeks, Last Month, Last 3 Months, and Custom Range.
- Choose a custom range for your snapshot by selecting the start and ends dates. If you do not specify a start date, Eggplant DAI uses the current date for that value.
If no date is specified, the dashboard displays data for the last seven days.
Test Results Record
The Test Results Record shows the distribution of successful and failed test runs for the selected date range. It captures information about exploratory test runs through your model as well as directed test cases. The status and type of runs are color-coded for easy reference.
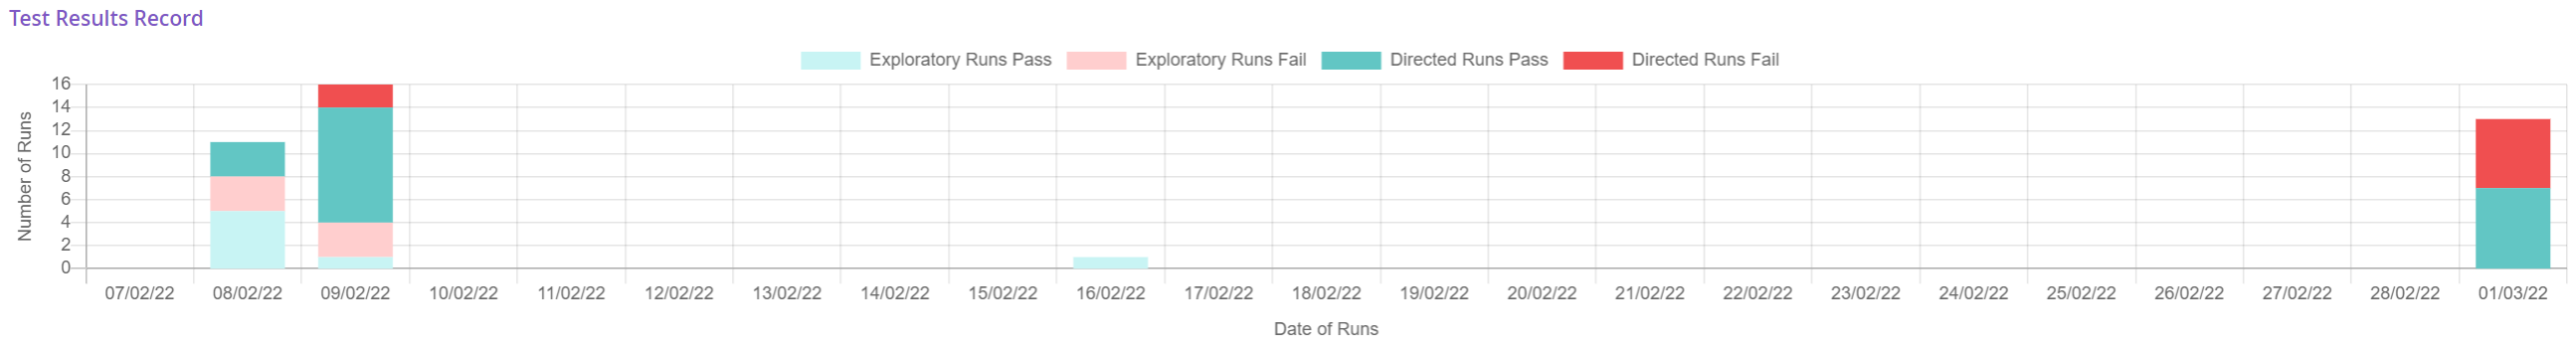
Test Results Record
All Runs (Exploratory/Directed)
The All Runs donut chart and legend represent how many of the model’s test cases have been executed for both exploratory and directed test cases.
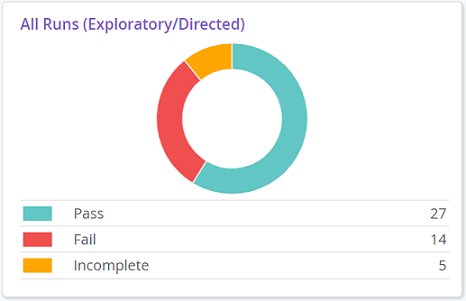
All runs (Exploratory/Directed)
The All Runs widget provides the following information:
- Pass: The total number of passed test runs.
- Fail: The total number of failed test runs. Incomplete: The total number of incomplete test runs which either resulted in errors or ended abruptly for various reasons.
Test Case Completion (Directed)
The Test Case Completion donut chart and legend show the proportion of directed test cases that exist for the selected model that have been run to pass or fail.
Test Results Record
- Completed Test Cases: The total number of successful test cases. If a test case has been run 10 times, it'll still be counted as one completed test case.
- Incomplete Test Cases: The total number of directed test cases that are incomplete or have not been attempted yet.
Failure Type
The Failure Type donut chart and legend shows a breakdown of test run failures for directed and exploratory tests.
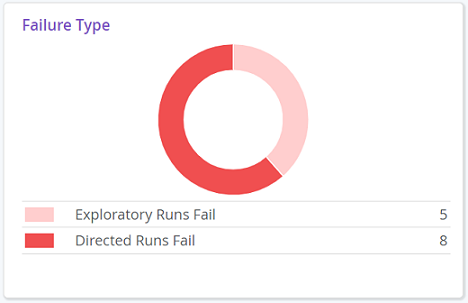
Failure Type
- Failed Exploratory Runs: The total number of failed test runs when running exploratory tests from both the Model workspace and Runner.
- Failed Directed Test Cases: The total number of directed test cases that failed when running tests from Designer > Test Cases.
Coverage
The Coverage donut chart and legend represent the test coverage of all the runs from the latest version of the model. Coverage represents what percentage of your model has been visited during test runs. During a test run, Eggplant DAI calculates coverage for possible paths based on various combinations of sequences of actions in the model.
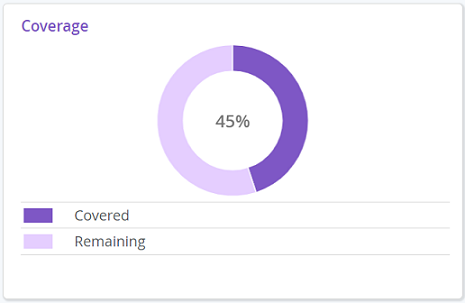
Test Coverage for model test runs
The maximum test coverage that can be achieved may be below 100%.
The Coverage chart provides the following information:
- Covered: The percentage of tests covered for all the runs in this model.
- Remaining: The percentage of tests that are yet to be covered, i.e., remaining paths of a model that have not been hit during the test run.
For more information on how to view the total coverage for your model, see Coverage.
Test Breakdown
The Test Case Breakdown chart shows success metrics for individual test cases that have been run.
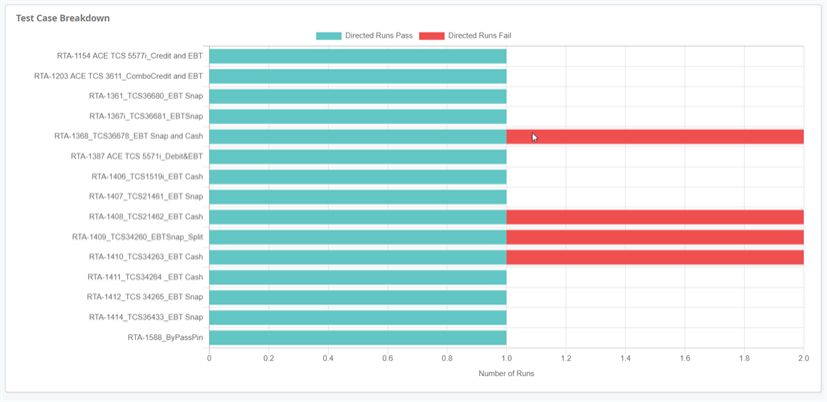
Test Case Breakdown chart for test cases