Account Settings
The Account Settings tab lets you access all the configuration settings for your monitoring services. It is where you modify your monitors, delete, and add new monitors, as well as adjust the alerting profiles and reporting preferences.
Settings
Alerts
The Alerts module is where you view all the Alerting Profiles within your account and modify the configuration set for any alerts. You can access Alerts via the link provided in General Settings section as well as the Alerts tab in Accounts Settings.
Profile Overview
The Profile Overview graph shows the alert profiles and when they are active (green) and inactive (red), it makes it easy to spot when there is incomplete alerting coverage.
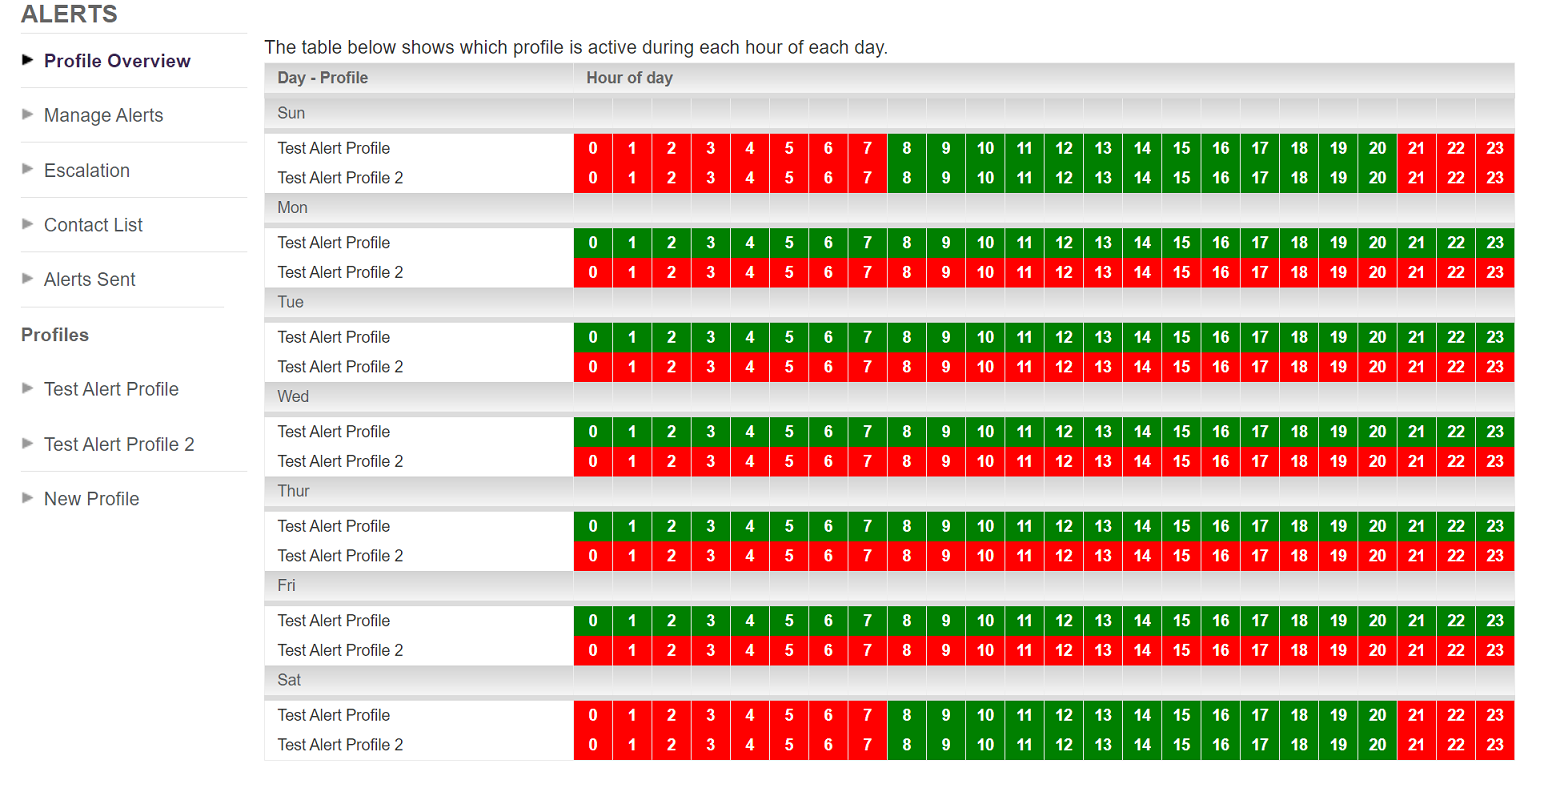
The ALERTS Profile Overview graph
Manage Alerts
In the Manage Alerts section, you can enable and disable alerting on any page, all page monitors, or steps within a user journey.
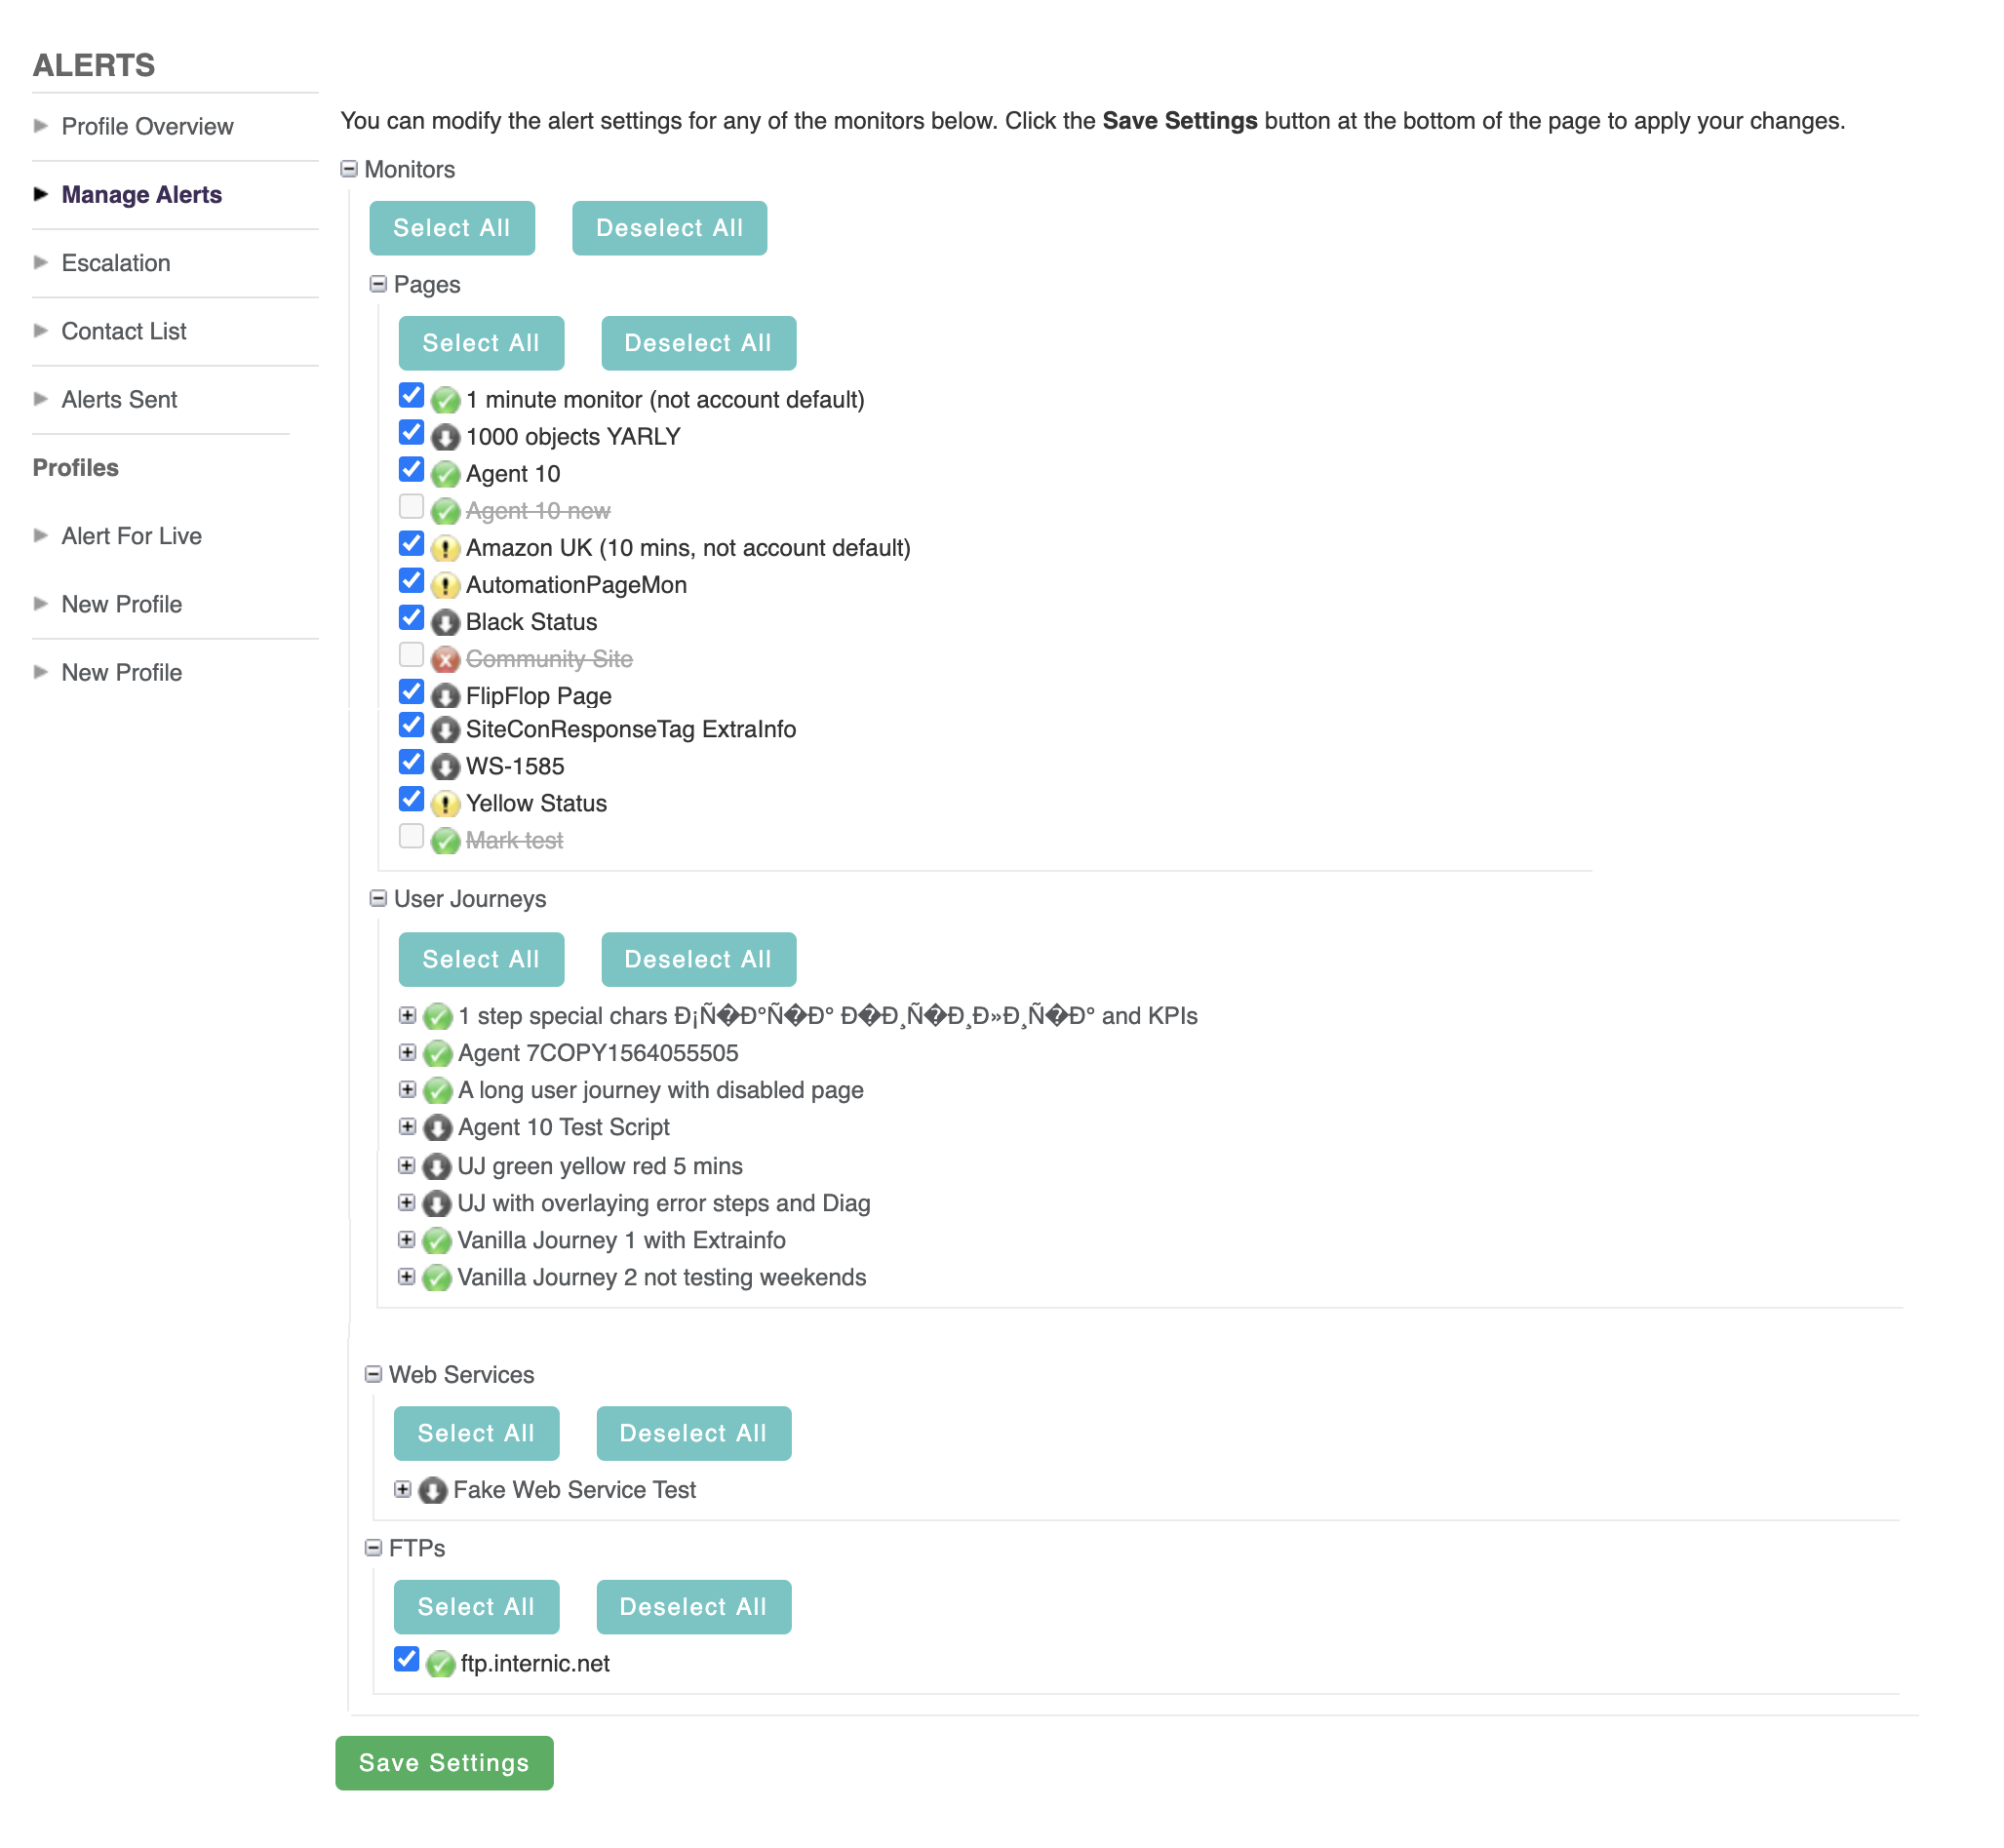
The Manage Alerts settings
Click the plus (+) sign to expand the Monitors section, e.g., User Journeys to reveal pages and steps. A check mark next to a Page monitor or User Journey step shows that page or step has alerting enabled. The strike through text indicates that testing is disabled for this monitor. Click Save Settings to apply any changes.
Alerts will only be generated if there is an alert profile covering that page or step.
Escalation
Escalation levels dictate how soon users are alerted after opening an alertable error. Each alert profile contains three levels of escalation which can be populated with contacts from the Contact List. Each number in the drop-down list represents the amount of failed tests and associated retests that must fail before all the contacts in that escalation level are alerted.
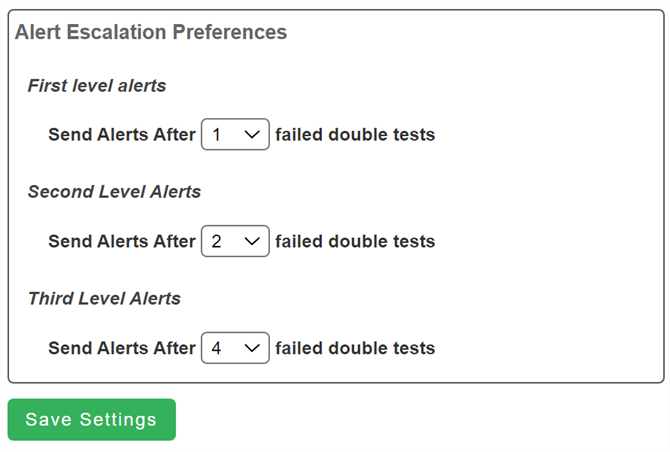
Alert Escalation Preferences
Every failed scheduled test triggers an immediate retest automatically. Two failed tests make up a failed double test. A typical setup includes the frontline support contacts in the 1st level so that they are alerted as soon as the retest fails. Other interested parties and management might then be configured to receive alerts only if the error has been opened for a particular length of time. For example, if the test frequency of a monitor is configured at 5 minutes, then setting the number of failed double tests to four prompts an alert if the error is open for at least fifteen minutes. You can click Save Settings to apply the changes to all alert profiles.
If you have more than one alert profile the escalation preferences you set here will be applied across all of your alert profiles.
Contact List
To configure users to receive alerts, they must first be included in the Contact List. The Contact List form allows you to add a new contact.
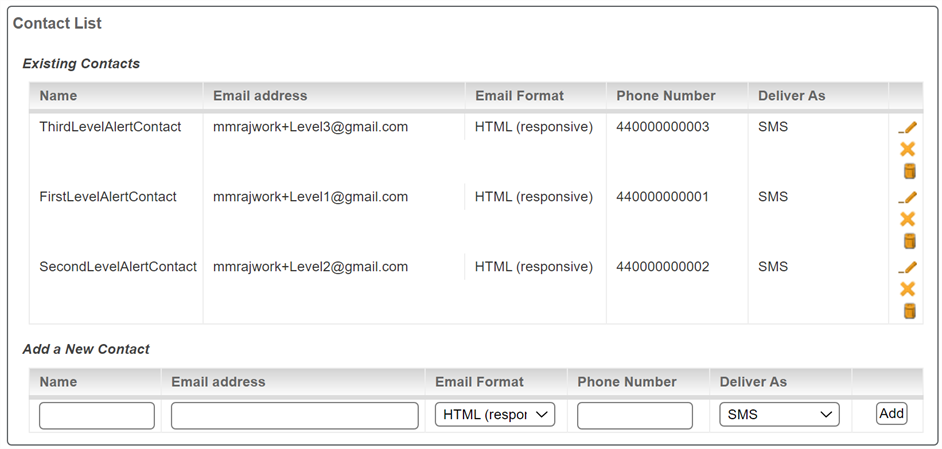
Use the Contact List to configure users to receive alerts, disable a contact, or delete a contact
To add a contact, follow these steps:
- Enter a name, valid email address, and a phone number.
- Select the format of the alert email from the Email Format drop-down list.
- Select the format of live alert that the contact should receive, e.g., SMS, pager, voice.
- Click Add to save the new contact.
All phone numbers (including UK) should start with international codes and not include either “+” or “00” or “()” For example +44 (0)1234 5678 would be entered as 4412345678.
The grayed-out entries indicate that a contact is disabled. To disable a contact, click on the ![]() icon against the entry, which will then change to a
icon against the entry, which will then change to a ![]() icon. You can re-enable the entry again by clicking on the
icon. You can re-enable the entry again by clicking on the ![]() icon.
icon.
To delete an entry, click the Delete ![]() icon against the entry.
icon against the entry.
Important: If you remove any contacts from this list by clicking on the ![]() icon against the contact, they will automatically be removed from any profiles they have been associated with. Only delete a contact if you are sure it is no longer required for any of your profiles.
icon against the contact, they will automatically be removed from any profiles they have been associated with. Only delete a contact if you are sure it is no longer required for any of your profiles.
Alerts Sent
The Alerts Sent report lets you view when and to whom the alerts were sent in the format they were delivered over a predefined time period.
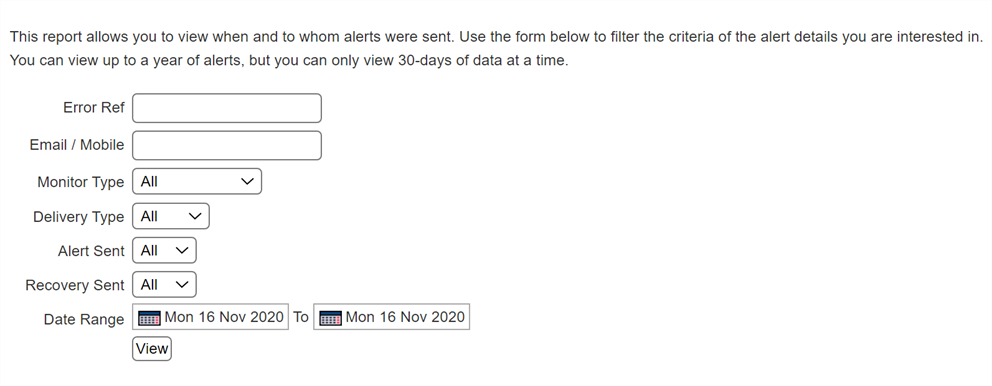
The Alert Sent report filters
Specify the filter criteria of the alert details you are interested in by customizing here:
- Error Ref: Searches for all alerts sent that relate to a particular Error Reference.
- Email / Mobile: Enables a search for all alerts sent with a particular email address or phone number.
- Monitor Type: Allows selection of all or individual types of monitors including Email Server, Email Tracker, FTP, Page, User Journey, and Web Service.
- Delivery Type: Limits results to only include a particular type of delivery mechanism. For example, SMS, Email, or Voice.
- Alert Sent and Recovery Sent: Allows a search of both options if both drop-down lists are set to All, then this allows a search for if both the alert was sent and the recovery was sent, otherwise this will search for one type of message.
- Date range: Allows specific dates to be searched as far back as 3 years.
Profiles
The Profiles section displays all the available profiles. Click the profile on the left to view the detailed configuration for that profile.
Clicking on the New Profile link opens a new blank alert profile. Each tab shows various details concerning the criteria to trigger this profile to send alerts and who to send them to.
- Contacts tab: Displays the users that are selected in each escalation level and what alert type is configured. Any contact that already exists in the Contact List can be selected within any one or more escalation levels. Delivery type can be selected by selecting the correct option for the Alert and Recovery messages. A contact can be configured to receive both types of alert messages. The Contacts tab also allows you to update the Profile Name with the free text box.
- Monitors tab: Lets you select the monitors that should be included in this profile. To change which monitors are included, use the instructions listed under Manage Alerts, but note that these settings are local to the specific alert profile rather than account-wide.
- Error Codes tab: Provides a list of error codes that can be selected to trigger this alert profile. For example, if one alert profile had infrastructure related error codes (e.g., DNS failure) selected, the contacts to be alerted might only be the infrastructure team. A separate alert profile could then be configured to send only the content related alerts (e.g., Page Size) to the team specifically concerned with maintaining the content.
- Schedules tab: Allows selection of set time periods for when this alert profile will be active. For example, separate profiles can be configured to alert different people during office hours or anti-social hours.
- Save Profile: Click this to save your new profile or update your existing profile.
- Delete Profile: Click to delete the whole profile from this monitoring account.
Webhook Profiles
The Webhook Profiles section displays all the webhook profiles configured for the selected account. You can add multiple webhook profiles per account, one for each unique PUSH API endpoint. In addition, webhook based alert notifications can be enabled and disabled independently for each monitor and step for the selected webhook profile.
To add a new Webhook Profile, see Integrating Webhooks in Monitoring.
Email Report
The Email Report tab lets you establish a list of email contacts to receive the email summary report and define whether those contacts should be sent a daily, weekly, or monthly summary. There are three formats of the standard Email Report that can be automatically sent out from the portal, which will display the availability and numbers of tests that have passed or failed in Severity category columns within the tables for each monitor.
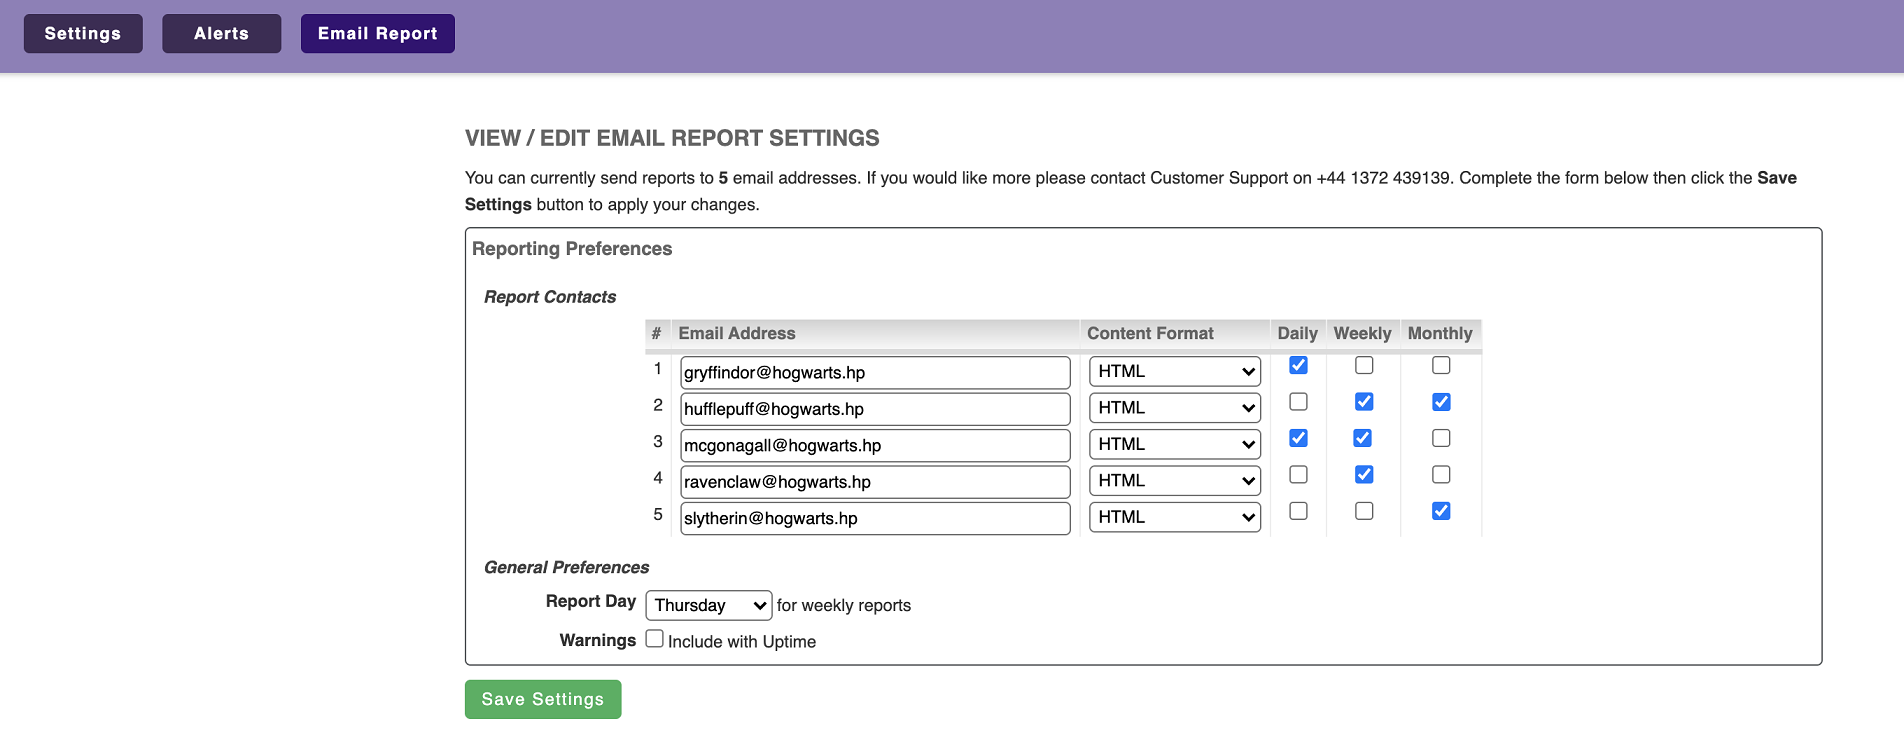
Email Report settings
Reporting Preferences
- Report Contacts
- Email Address: The email addresses of the contacts that need to receive the reports.
- Content Format: The format in which the report should be sent. The options are: Plain Text, HTML, Email Attachment.
- Daily/Weekly/Monthly: Select the appropriate time period version of the report for each contact email.
General Preferences
- Report Day: Allows selection of day of the week to generate weekly report
- Warnings: Select Include with uptime to add any downtime caused by a warning error to the uptime column in the report. Enabling this option effectively sets the Warnings column to hidden.
Account Preferences
Although labeled as personal report preferences some settings on this page will affect the whole monitoring account. Data is recorded and stored in the test agent database in GMT and then translated by the portal during display.
- Personal Report Preferences
- Benchmark Sector: Sets the industrial sector of organization. This shows in the Average Speed reports as an average speed for that sector.
- Monitoring Frequency: Configures the default testing frequency of the Page test monitors, which is also applied to Login and FTP monitors.
- Google Analytics: Select this to enable the ability to overlay Google Analytics in the Page Analysis Report and present them in the Customise View page with the username and password fields.
Any changes on this page will become active after clicking the Save Settings button.
Monitor Display Order
The Monitor Display Order tab lets you change the display order of the monitors within each section to change the way those monitors show in the reports and settings.
- Click the monitor type header to expand the view to reveal the monitors in that section.
- To reorder a monitor, select it and drag it to a different position in the list.
- To order the monitors alphabetically for the whole account, click the Order Monitors Alphabetically button.
- Click Save Settings to save all the changes.